Azure Logic Apps Overview
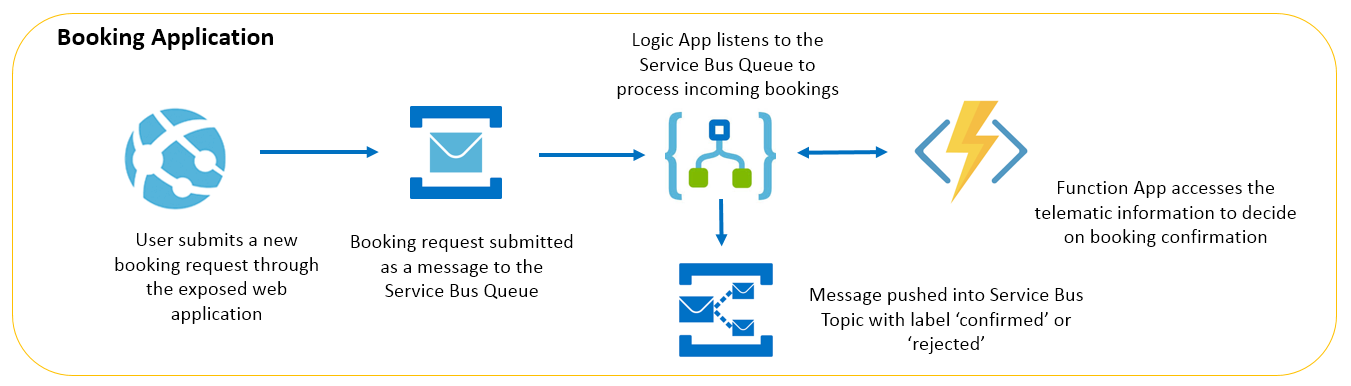
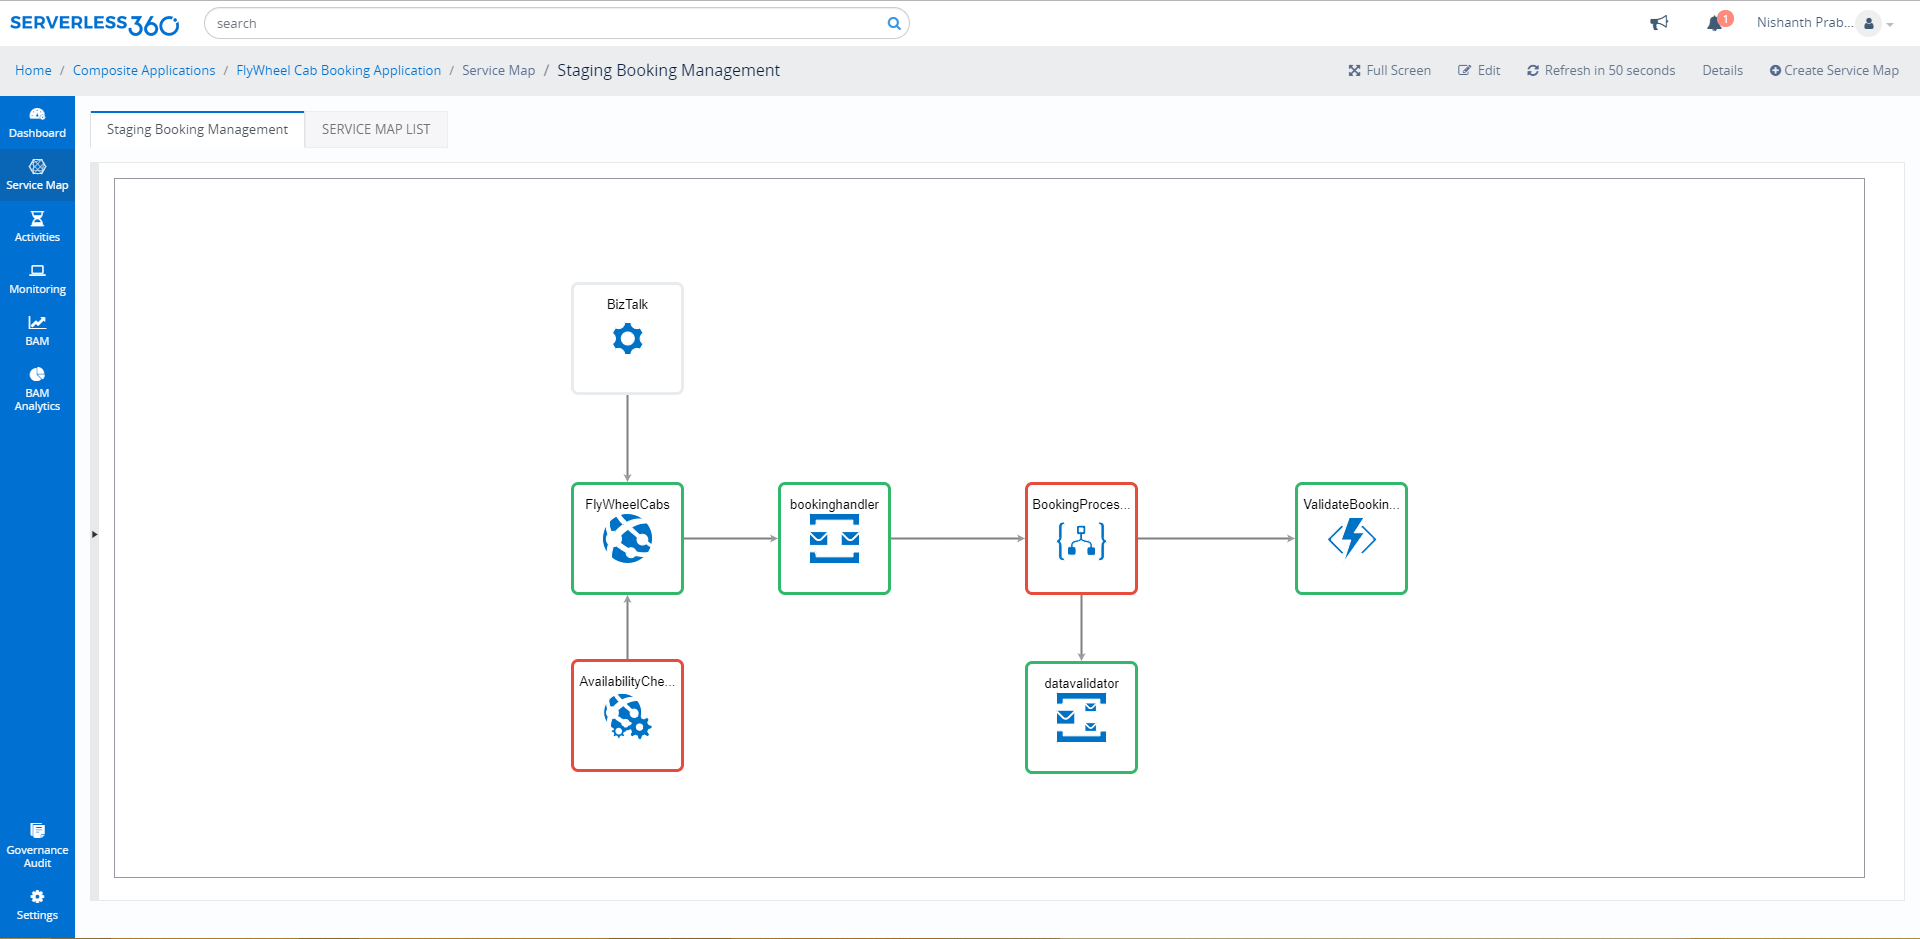
This pillar page deals with features of Azure Logic Apps and how it can be managed and monitored with Turbo360. For a better understanding of Azure Logic Apps, let us consider a business scenario, FlyWheel Cab Booking Application. There are two main components in the application, the Vehicle Telematics application to collect real-time data of the cabs to provide necessary information for booking. The Booking application to facilitate cab booking by customers. The booking application is built using Azure Serverless resources like Web App, Service Bus Queue and Topic, Logic App, and Azure Function which is of focus now. Below is the Service map illustrating how these Azure Services are integrated together by Azure Logic Apps.
Going forward in this article we would focus on the Azure Logic App which defines the business workflow.
What is Azure Logic Apps?
Azure Logic Apps is a cloud service. Using Logic Apps defines the workflow at ease consuming a range of APIs exposed as Connectors. These Logic App connectors will perform the sequence of actions defined in the workflow whenever the trigger gets fired.
Compare event-driven Azure Services
While choosing Azure Logic Apps to define the business workflow it is also necessary to gain knowledge on other available options. This section will throw light on the Azure offered alternatives to define a business workflow.
Microsoft Flow
Microsoft Flow is a Software as a Service offering from Microsoft Azure used to define the workflows using connectors and it doesn’t need an Azure subscription to start with. Though it is possible to define the workflow using Microsoft Flow for free, it has some limitations over Azure Logic Apps.
Microsoft Flow does not support any Enterprise connectors, no governance and no Integration with Azure DevOps for CI/CD deployment.
In contrast, Azure Logic Apps exhibit support to a wide variety of services like activity log for Governance, Enterprise connectors, Integration with Visual Studio and more.
Read more: Azure Logic Apps vs Power Automate
Azure Durable Functions
Azure Durable Function is a Platform as a Service, offered by Azure with which users can define a piece of code to be executed on a trigger. Below are various types of triggers available for Azure Functions:
- Queue Trigger
- Timer Trigger
- Event Trigger
- Http Trigger
It is possible to define the workflow with Azure Durable functions. Durable function consists of Orchestrator, Orchestrator Client and Activity Functions. Orchestrator Client will send a request to Orchestrator which will define the workflow several Activity Functions.
Though the Azure Durable Function supports defining workflow, user must write the custom code, which is time consuming whereas in Azure Logic Apps, there is no need for custom code, user can straight away define the workflow using predefined APIs available as connectors.
Read more: Logic Apps or Durable Functions: Which approach suits me best?
Key components of Logic Apps
With this understanding of Azure Logic Apps, lets straight away jump into some of the key components of Logic Apps and understand how it works?
Workflows
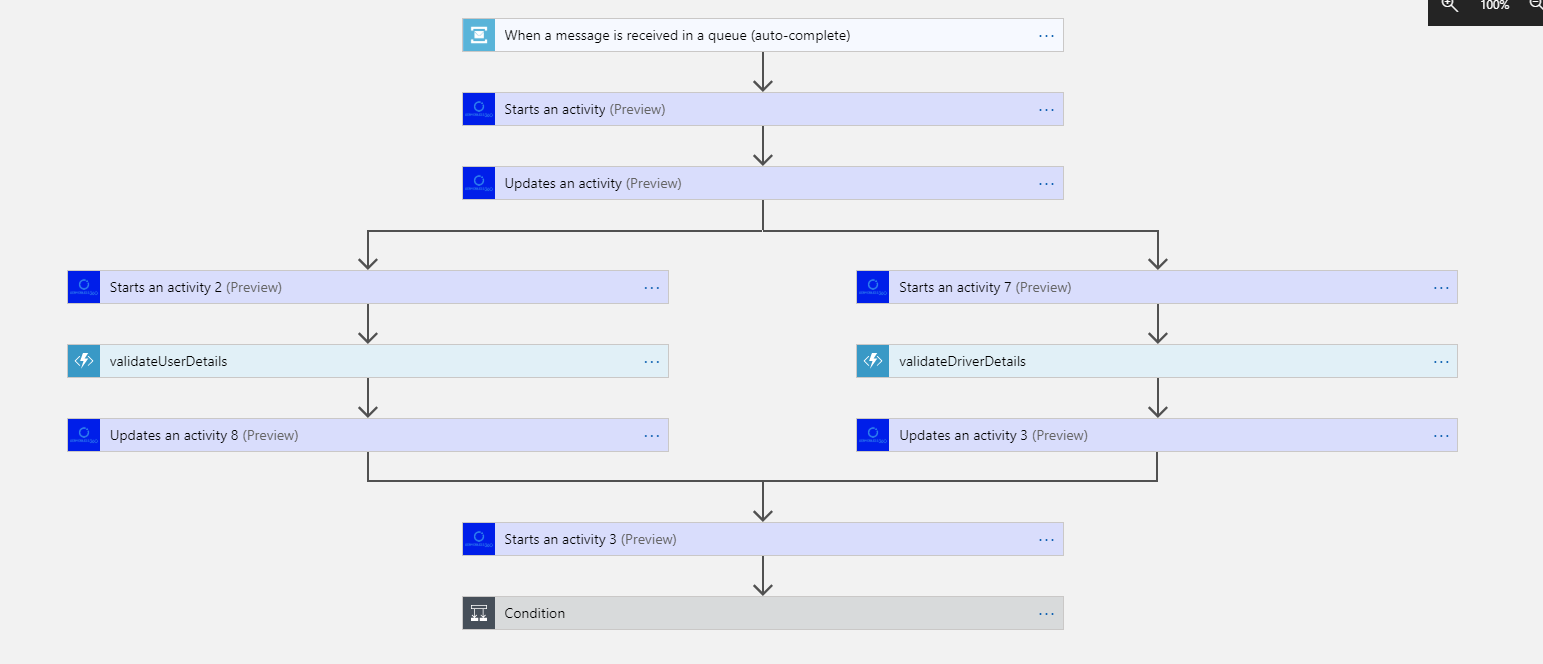
Workflow in an Azure Logic App is a sequence of actions or processes defined in steps. The actions will perform the business operations when input is provided through the managed connectors. Every workflow will be initiated by the trigger being fired. By defining the Workflow in Azure Logic Apps, Business processes can be automated and visualized in a hierarchy. Below is the image of the Azure Logic App workflow:
Managed Connectors
What are Logic App connectors?
Connectors in Azure Logic Apps are used to perform certain actions or processes. These connectors are designed to connect and work with user data. There are numerous connectors available for Azure Logic Apps including Enterprise connectors. Users can use pre-defined connectors as well as create their own custom connectors. It is also possible to define connectors using ARM templates. Connectors in Azure Logic Apps may act either as actions or as triggers.
How do I add connectors to Logic App?
- Move to the Azure portal and click on Create a resource.
- Enter Logic Apps Custom Connector in the search box and select it from the drop-down.
- In Logic Apps Custom Connector, select Create.
- Register the connector by providing the details and choose Review + create.
- Review the details entered and click on Create.
After creating the custom connector resource, the menu opens automatically. If it doesn’t, you can go to the subscription and resource group you selected and open it directly. With the custom connector in hand, you can define the connector’s behaviour.
Actions
Actions are the steps those run once initiated by the trigger. Whenever a Azure Logic App gets triggered, there will be a succession of actions those run to complete the workflow. Actions are processes those will perform the designated business task based on the data provided by the user. Users can select the required action from the extensive set of actions available in the connector repository.
Triggers
Triggers are the starting point for a Azure Logic App workflow that will fire when new data or event that meets the trigger condition occur. Connectors in Logic Apps itself provide various triggers. Custom triggers can also be created using custom connectors.
How do you trigger a Logic App?
- Create a blank Logic App in the Azure Portal
- Select or search the trigger from the list given in the Logic App Designer
- Run a trigger in a saved Logic App by using the Run Trigger option in the overview section
Can a Logic App have multiple triggers?
Yes, multiple triggers can be defined in a Logic App. Multiple triggers can be accommodated in a Logic App workflow. As mentioned by Microsoft Azure, a single Logic App can have up to 10 triggers in it. In general, triggers are of two types:
- Built-in triggers
- Managed API triggers
Built-in triggers are the predefined triggers using Http protocol and schedule for triggering the Azure Logic Apps. There are several Built-in trigger types like HTTP, HTTP Endpoint, Recurrence, and Request.
Managed API triggers are based on the API connections / API Webhook connections which check an endpoint using custom connectors.
How to create API connection in Azure Logic App?
- Select All services > Web > API Connections from the Azure portal menu.
- Select All resources from the Azure portal menu. The Type filter should be set to API Connection.
Let us further discuss the creation and working part of Azure Logic Apps.
How does Logic App work?
Azure Logic App works based on the workflow defined. Consider the Logic App in the Fly Wheel Cab Booking Application, defined with a trigger, Service Bus Trigger – “When a message is received in a queue”, followed by a series of actions. Now whenever the queue receives the message on a new booking, it will trigger the series of actions to run and workflow to complete.
The Values from one action will be passed on to the subsequent action through the dynamic values. According to the Azure Logic App pricing model, the cost for a Logic App is based on the Number of Actions, triggers and runs executed.
Are you looking to reduce Azure logic apps cost for maximum savings? Check out our Azure logic apps cost optimization guide
How to create a Logic App?
The first step to start with a Logic App is to create one. Following are the steps to create a Logic App:
- In the Azure Portal, click on create a resource and select Logic Apps from the marketplace
- Click create to proceed
- Provide the basic credentials and click Review + Create
- Finally, click on Go to resource to navigate to the Logic App created.
How do I authenticate my Azure Logic App?
Based on where your logic app processes execute, Azure Logic Apps provides the system-assigned managed identity, which you can use with only one logic app resource, and the user-assigned managed identity, which you may share across a collection of logic app resources.
- Open your logic app resource in the Azure portal.
- Select Identity from the logic app’s Settings menu.
- Select On > Save in the Identity window under System assigned. When Azure asks if you want to confirm, say yes.
- The system-assigned identity, which is registered with Azure AD and represented by an object ID, can now be used by your logic app resource.
How do you call Azure Logic Apps?
Below are the steps to call a Logic App from an existing Logic App
- Select New step > Add an action under the step where you want to invoke another logic app.
- Select Built-in from the drop-down menu under Choose an action. Enter logic apps as a filter in the search box. Choose a Logic Apps workflow from the activities list.
- Inside the existing logic app, nest a logic app.
- The designer displays the logic apps that are eligible for selection.
- Choose a logic app to call from the current logic app.
Logic Apps concepts
With an understanding of basic parameters of Azure Logic App, let’s jump on to the concepts those need to be considered when dealing with Azure Logic Apps.
Logic App state
The Azure Logic App can be in Enabled/Disabled state. User can modify the Logic App state from portal itself.
How do I turn off Azure Logic App?
- In the Azure portal, open your Logic App.
- Under Logic App’s menu select Overview and click on Disable option from the toolbar.
- To disable multiple Logic Apps, move into the Logic App section, bulk select and disable the Logic Apps.
- Succeeded – When the Logic Apps run/trigger is succeeded
- Running – When the Logic App run/trigger is Running
- Failed – When the Logic App run/trigger is Failed
- Skipped – When the Logic App run/trigger is Skipped
- Timed Out – When the Logic App run/trigger is Timed Out
With the various state of the Logic App, users can check the health of the Logic App.
How long can a logic app run?
The default run limit for synchronous actions in a multi-tenant Logic App is 120 seconds that is 2 minutes.
How do you troubleshoot Logic App?
Logic app generates data that can help you in diagnosing and debugging errors in the app. In Azure portal, you can diagnose a logic app by analysing each stage of the workflow.
- Check trigger history
- Check runs history
- Perform runtime debugging
Define workflow to meet business needs
Let us consider the Flywheel cab booking application, to define the Cab booking Scenario as a workflow using Azure Logic Apps. The client application will send the Booking message consisting of business data like User ID, Driver ID, Location, Price and Destination to a Service bus a queue. Now the requirement is to check whether the User ID and Driver ID is valid. Here comes the Logic App with the service bus queue trigger – “When a message is received in queue”. Now the Action can be the invocation of Function apps which will check whether the User ID and Driver ID in the Service bus message is valid or not. If Both User ID and Driver ID are valid, the Label of the Message will be set to true and the message will be sent to Azure Service bus topic through Topic connector. Now whenever the Service bus queue receives the booking message, the message will be validated and moved to Azure Service Bus Topic Subscription.
From the above Scenario, we can understand how the Logic App works with various triggers and actions.
Understand Logic App metrics
Azure metrics give information on the status of the resources in the Azure Subscription. With the extensive set of metrics, user can detect the health of the Azure Logic Apps. Metrics can also help troubleshoot root-cause of issues without needing to contact Azure support.
Action Metrics
These are the metrics related to Actions in the Logic App workflow
| Metric Name | Description | Monitoring Perspective |
|---|---|---|
| Action Latency | The average time taken between when an action starts and ends
Unit: Seconds Aggregation: Total Dimension: Entity Name |
Performance |
| Actions Succeeded | The number of Actions succeeded in the Logic App runs in the given time
Unit: Count Aggregation: Total Dimension: Entity Name |
Availability |
| Actions Failed | The number of Actions failed in the Logic App runs in the given time
Unit: Count Aggregation: Total Dimensions: Entity Name |
Reliability |
| Action Skipped | The number of Actions skipped in the Logic App runs in the given time
Unit: Count Aggregation: Total Dimensions: Entity Name |
Frequency |
| Billable Action Executions | The number of Actions that cost for the Execution
Unit: Count Aggregation: Total Dimensions: Entity Name |
Consumption |
Run Metrics
These metrics are related to the runs of the workflow:
| Metric Name | Description | Monitoring Perspective |
|---|---|---|
| Run Latency | The average time taken between when a run starts and ends
Unit: Seconds Aggregation: Total Dimension: Entity Name |
Performance |
| Run Succeeded | The number of runs succeeded in the given time
Unit: Count Aggregation: Total Dimension: Entity Name |
Availability |
| Run Failed | The number of runs failed in the given time
Unit: Count Aggregation: Total Dimensions: Entity Name |
Reliability |
| Run Skipped | The number of runs skipped in the given time
Unit: Count Aggregation: Total Dimensions: Entity Name |
Frequency |
| Run Success Percentage | The number of successful runs divided by the total
Unit: Count Aggregation: Total Dimensions: Entity Name |
Reliability |
Trigger Metrics
These metrics are related to the triggers of the workflow:
| Metric | Description | Monitoring Perspective |
|---|---|---|
| Trigger Fire Latency | The time taken for firing the trigger of the Logic app in the given time
Unit: Seconds Aggregation: Total Dimensions: Entity Name |
Performance |
| Trigger Succeeded | The number of triggers succeeded in the given time
Unit: Count Aggregation: Total Dimension: Entity Name |
Availability |
| Trigger Failed | The number of triggers failed in the given time
Unit: Count Aggregation: Total Dimensions: Entity Name |
Reliability |
| Trigger Skipped | The number of triggers skipped in the given time
Unit: Count Aggregation: Total Dimensions: Entity Name |
Frequency |
| Billable Trigger Execution | The number of Triggers that cost for the Execution
Unit: Count Aggregation: Total Dimensions: Entity Name |
Consumption |
How do I debug Logic App?
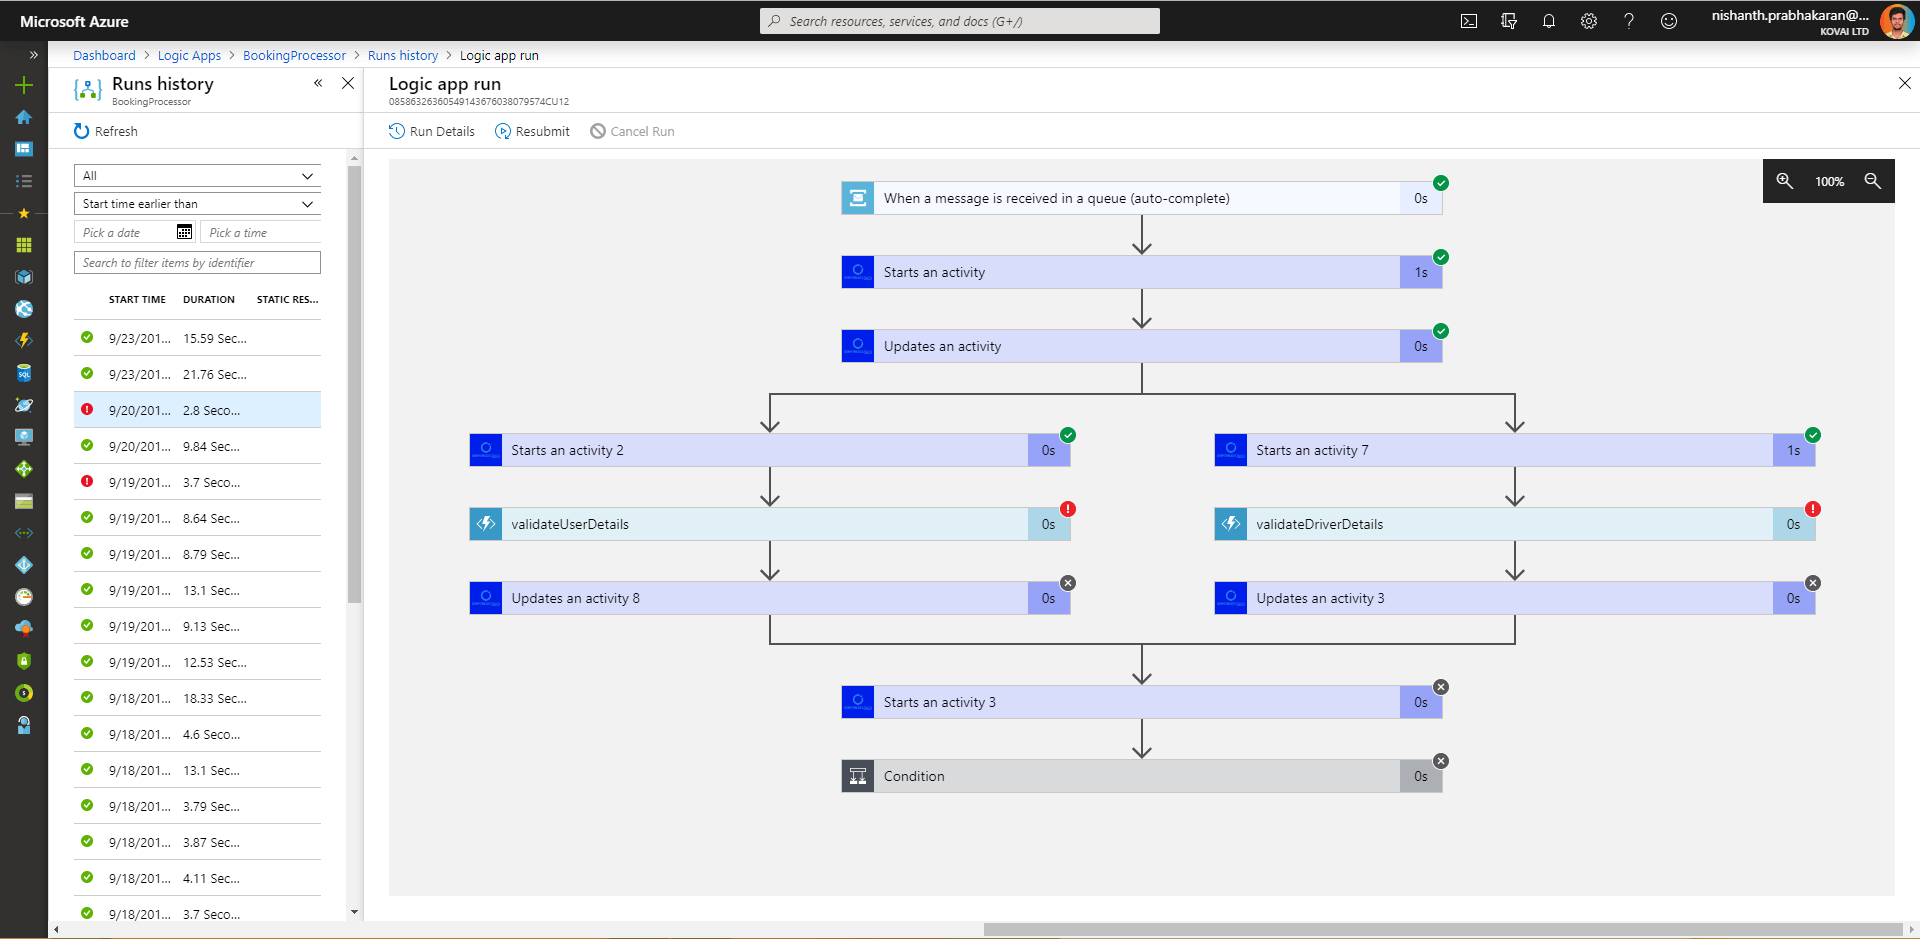
When it comes to debugging the Azure Logic Apps, there will be a need for triggers and run history to check if every action has performed well. When there is any failure in at least one of the run actions, the whole run will be shown as the failure. Users can get into the failed run and debug the failure. Following are the steps to debug a Logic App:
- On the Logic App overview section, click on see trigger history to check if any triggers have failed.
- Next, check for failed runs in the run history listed in the overview section.
- Click on the failed run and perform runtime debugging.
Azure Logic App pricing
Azure Logic App Pricing is completely based on executions of triggers, actions, and connectors.
- Actions – $0.000025/ Exec
- Standard Connector – $0.000125/ Exec
- Enterprise Connector – $0.001/ Exec
For Integration Service Environment (ISE), the pricing counts on the base unit and scale unit. For Integration account with Logic App B2B, the pricing will vary based on the tiers
- Basic – $0.42/ Hr
- Standard – $1.37/ Hr
What are the benefits of using Azure Logic Apps?
Azure Logic Apps have remarkable advantages which can solve various business challenges.
Below are some of the advantages of Azure Logic Apps
- Easy to define the workflow – User can easily define the workflow with triggers and actions with user-intuitive GUI
- Support for Enterprise applications – Logic Apps support integration with Office 365, Twitter, Dropbox and more
- Easy debugging – User can easily debug the Logic App using Trigger and Run history
- Automation of workflow – By defining the workflow with triggers, it will automatically fire the Logic App when the trigger condition is succeeded
- Integration with on-premise solutions – It is also possible to integrate the Logic App with on-premise solutions like BizTalk server, SAP and more
Logic App Integration Account
Integration account with Logic Apps will be needed for Enterprise Integration and B2B solutions. By Integrating the Integration account with Logic Apps, user can store all the artefacts at one place, build B2B workflows, integrate with Third-party SaaS applications and more.
How do I secure my Azure Logic App?
Logic App ISE
Integration Service Environment (ISE) is where users can run their Logic App which can interact with the services as VMs secured inside the Azure Virtual Network. The Logic App and its storage will be isolated from public Logic App services. Hence isolating the Azure Logic Apps will improve its performance too.
Sentiment Analysis with Azure Logic Apps
Till now we got the light on Logic App Integration, Pricing, and Metrics. Now the focus will be on some use cases like Sentiment Analysis with Azure Logic Apps. In this Sentimental Analysis, we will rank the tweets with the hashtag by using Logic Apps and other services. Whenever there is a tweet with some hashtag, the Azure Logic App will get triggered and with the help of Cognitive Service, it will score the tweet and store it into the blob storage and some of the score data will be sent to Power BI for analytics. Read more in detail on Sentimental Analysis with Azure Logic Apps
Azure Logic Apps with Mock Data
Another use case we can see is Apartment Customer Service built with Azure Logic Apps. In this scenario, the customer wants to place a ticket to the customer support of the apartment about the maintenance work. Logic App will watch the ticket if the request by the customer is addressed. Once the request is addressed, it will send the mail to the customer saying the work is completed. Read more on Testing Azure Logic Apps with Mock Data for the implementation of this Scenario.
Native monitoring tools for Logic Apps
By now it is very clear how powerful Azure Logic Apps are. The ease of addressing the business use cases using Logic App connectors makes them the best choice while building complex business orchestrations. However, monitoring azure logic apps in the Azure portal is not so simple and straight forward. This opens scope for tools to better manage and monitor Azure Logic Apps.
Log Analytics
Log Analytics is a tool to execute the Azure monitor Log Queries. By turning on the Log Analytics while creating the Logic App, user can perform monitoring and diagnostics logging for Azure Logic Apps. User can also query the log for efficient debugging. By configuring the Log Analytics, user can get the complete view. E.g., number of actions failed, number of triggers failed and more. Below are the detailed steps to enable Log Analytics for Azure Logic App:
How do I enable Log Analytics in Azure Logic App?
You can enable log analytics once you create your Logic App. Follow these steps on the Azure portal, where you submit the details to create your logic app:
- Select On under Log Analytics.
- Select the workspace where you want the data from your logic app to be sent from the Log Analytics workspace list.
- After you complete this step, Azure will create your logic app, which will be linked to your Log Analytics workspace. This step also installs the Logic Apps Management solution in your workplace automatically.
- Select Create when you’re finished.
How do you check logs in Azure Logic App?
You may view the data from your logic app’s runs in your Log Analytics workspace after it has completed.
- Find and open your Log Analytics workspace via the Azure portal.
- Select Workspace summary > Logic Apps Management from the workspace menu.
- Select the row for a logic app or status to see all the runs for that logic app or status. You can also view tracked properties by clicking View in the Tracked Properties column for actions where you put them up. Use the column filter to find the properties that have been tracked.
- Client-side and server-side filtering are both options for filtering your results.
- Client-side filter:Choose the filters you want for each column.
- Server-side filter:Use the scope control at the top of the page to select a certain time window or to limit the number of runs that display. By default, only 1,000 records are displayed at once.
- Select the row for a logic app run to see all the actions and their information for that run.
App Insights
As mentioned, App Insights is available only for the Logic App Standard resource type. When you create a new Azure Logic Apps (Standard) instance, you can directly associate it with App Insights, with which you can determine the overall health of the service nodes that are hosted within your Azure Logic Apps (Standard) instance.
Azure Monitor
Get to set up monitoring and alerting on the Azure Logic Apps. With this, you get to monitor the run status, Logic App triggers and failures. For instance, you can configure to get notified whenever a Logic app run fails more than a certain number of times.
Read more: List of Top Azure Monitoring Tools
Enterprise-grade monitoring tool: Turbo360
Azure Logic Apps solve huge business challenges with easy workflow design and automation but managing and monitoring the Azure Logic Apps in application context is not possible with Azure Portal. With the help of Turbo360’s Azure Logic Apps monitoring tool, user can manage and monitor the Azure Logic Apps in the efficient way.
Turbo360 vs Azure Monitor
Azure Monitor restricts monitoring Logic Apps only on a few metrics per alert rule and if you want to monitor it on more metrics, additional alerts have to be configured. This results in increased cost, whereas a platform like Turbo360 allows to monitor any number of metrics under a single alert.
|
Capability |
Azure Monitor |
Turbo360 |
|
Monitoring Logic Apps on multiple metrics at no extra cost |
✗ |
✓ |
|
Unified monitoring at the application level |
✗ |
✓ |
|
Intuitive Dashboards |
✓ |
✓ |
|
Alerts on critical problems |
✓ |
✓ |
|
Consolidated alerting |
✗ |
✓ |
|
Auto-correct Logic App status |
✗ |
✓ |
|
Root-cause analysis |
✗ |
✓ |
|
Repair & resubmit failed Logic App runs |
✗ |
✓ |
|
End-to-end tracing |
✗ |
✓ |
Read more: A detailed comparison between Azure Monitor and Turbo360
Turbo360 vs Insights using Log Analytics
Since Application Insights is not available for Azure Logic Apps, user can monitor the status of the runs with a small work around using Log analytics and Logic App Management. While creating the Azure Logic Apps, user need to enable the Log Analytics and workspace. Once the Logic App is created, user need to enable the Send to Log Analytics and configure the appropriate workspace in Diagnostics Settings. Now the user can monitor the runs in Logic App Management workspace. With this work around, user can only track the status of the runs, actions and connectors.
Whereas with Turbo360, user can manage and monitor Azure Serverless resources as well as with BAM in Turbo360, user can perform end-to-end distributed tracing on the Business Process and the message flow through the orchestration. With Turbo360, user can monitor the Azure resources in various perspectives and it also has integration with Various Notification channels like
- Microsoft Teams
- Slack
- Pager Duty
- SMTP
- OMS
- Web Hook
- Service Now
Read more: Turbo360 vs Application Insights in-depth comparison
Turbo360 vs Log Analytics
With Log Analytics, User can view the monitor logs on whether the run is succeeded or not, but it is not possible to monitor the state of every Actions and triggers. For this Challenge, user need to go with Turbo360 for monitoring Azure Logic Apps. In Turbo360, user can monitor the Performance, latency, Billable executions and more.
Manage Azure Logic App in Turbo360
With Turbo360 Azure Logic App Management tool, user can perform various remote actions and operations on Azure Logic Apps with all actions Governed and Audited and possible to monitor the Azure Logic Apps with extensive set of metrics
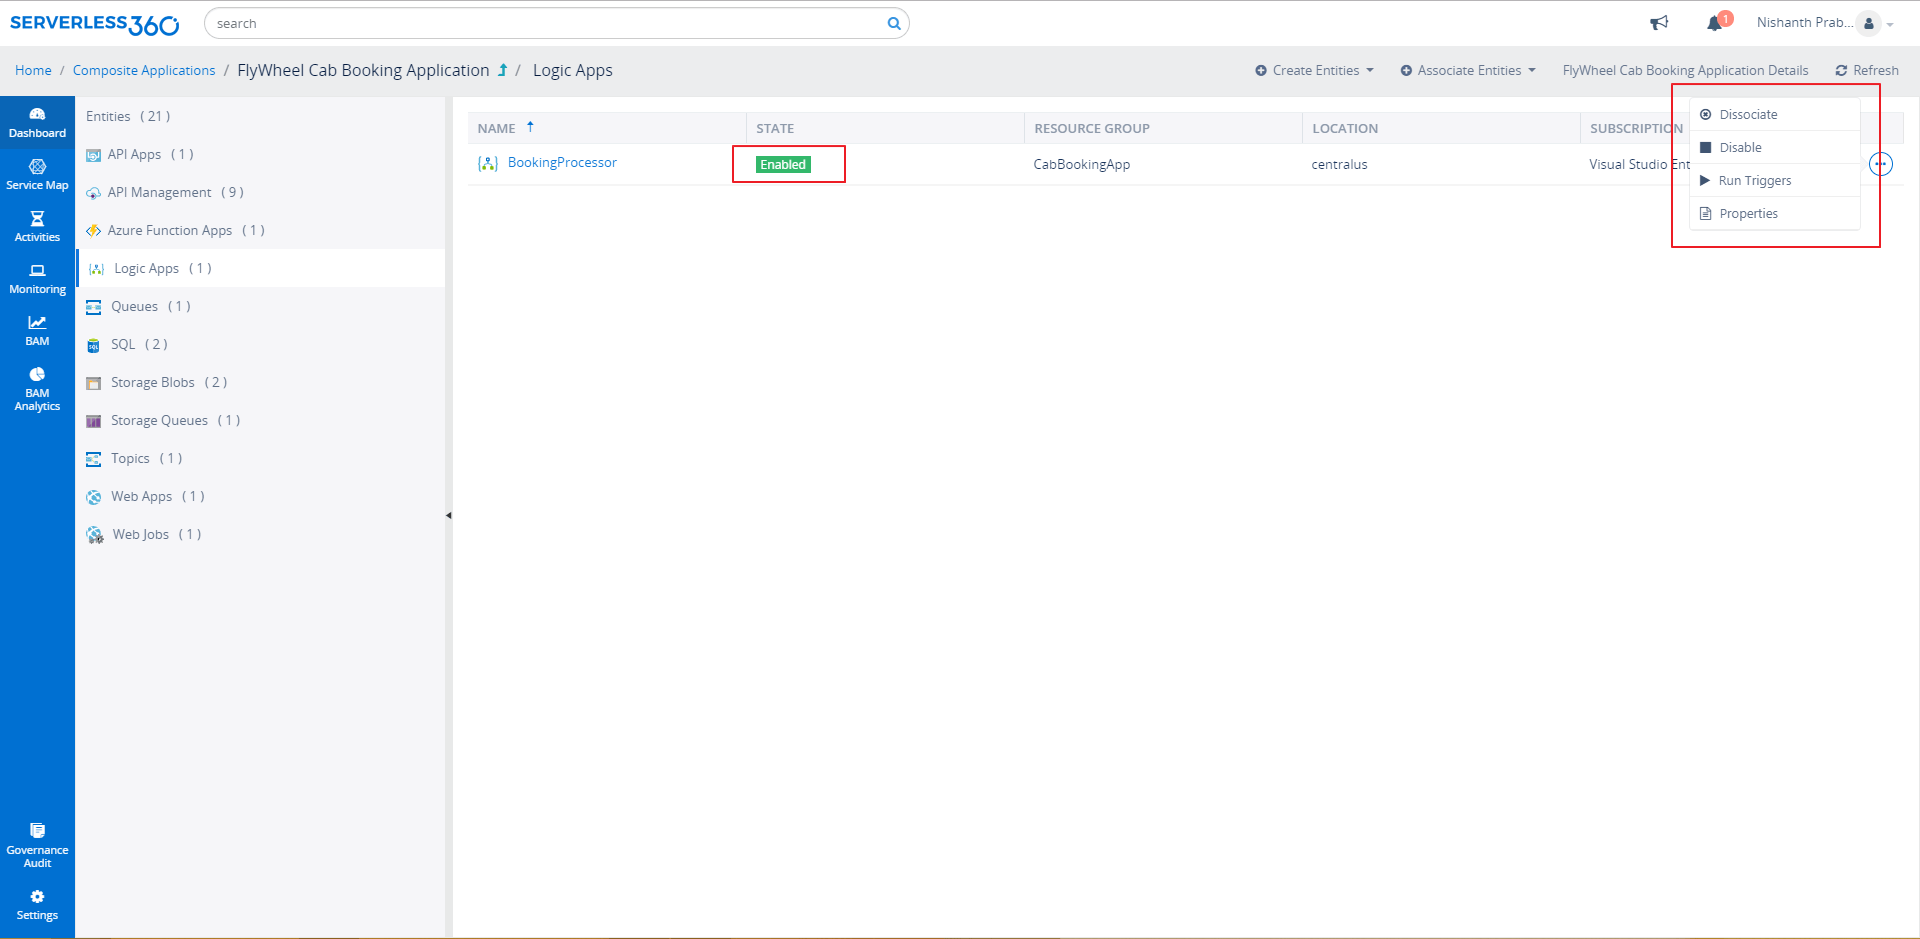
Modify state
In Turbo360, the user can modify the state of the entity like Enable/Disable or run the triggers if there is a need to test the Azure Logic Apps. User can also access the properties like Resource Group Name, Region Name and Subscription Name of the Logic Apps.
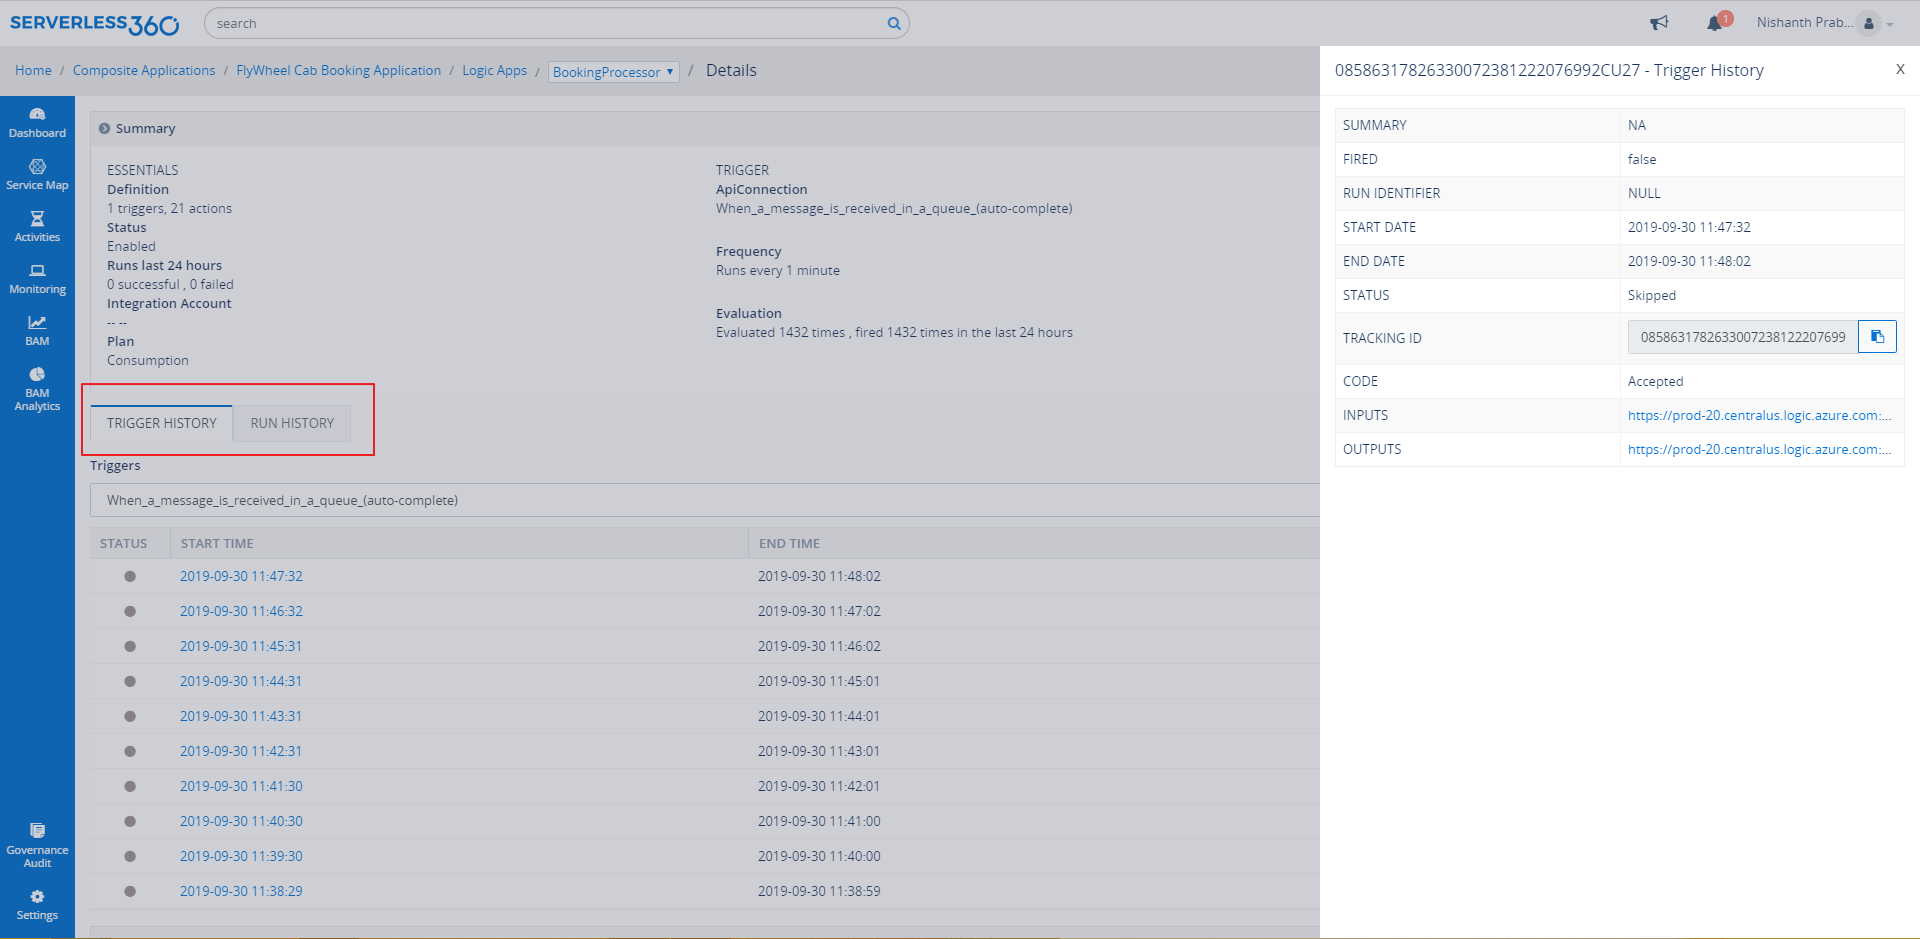
Access Trigger and run details
With the help of Turbo360, the user can access the trigger and run history. User can also access the Input and Output bound of the Logic Apps triggers and Run Actions. This would be of great help for DevOps engineers to investigate why a run action failed?
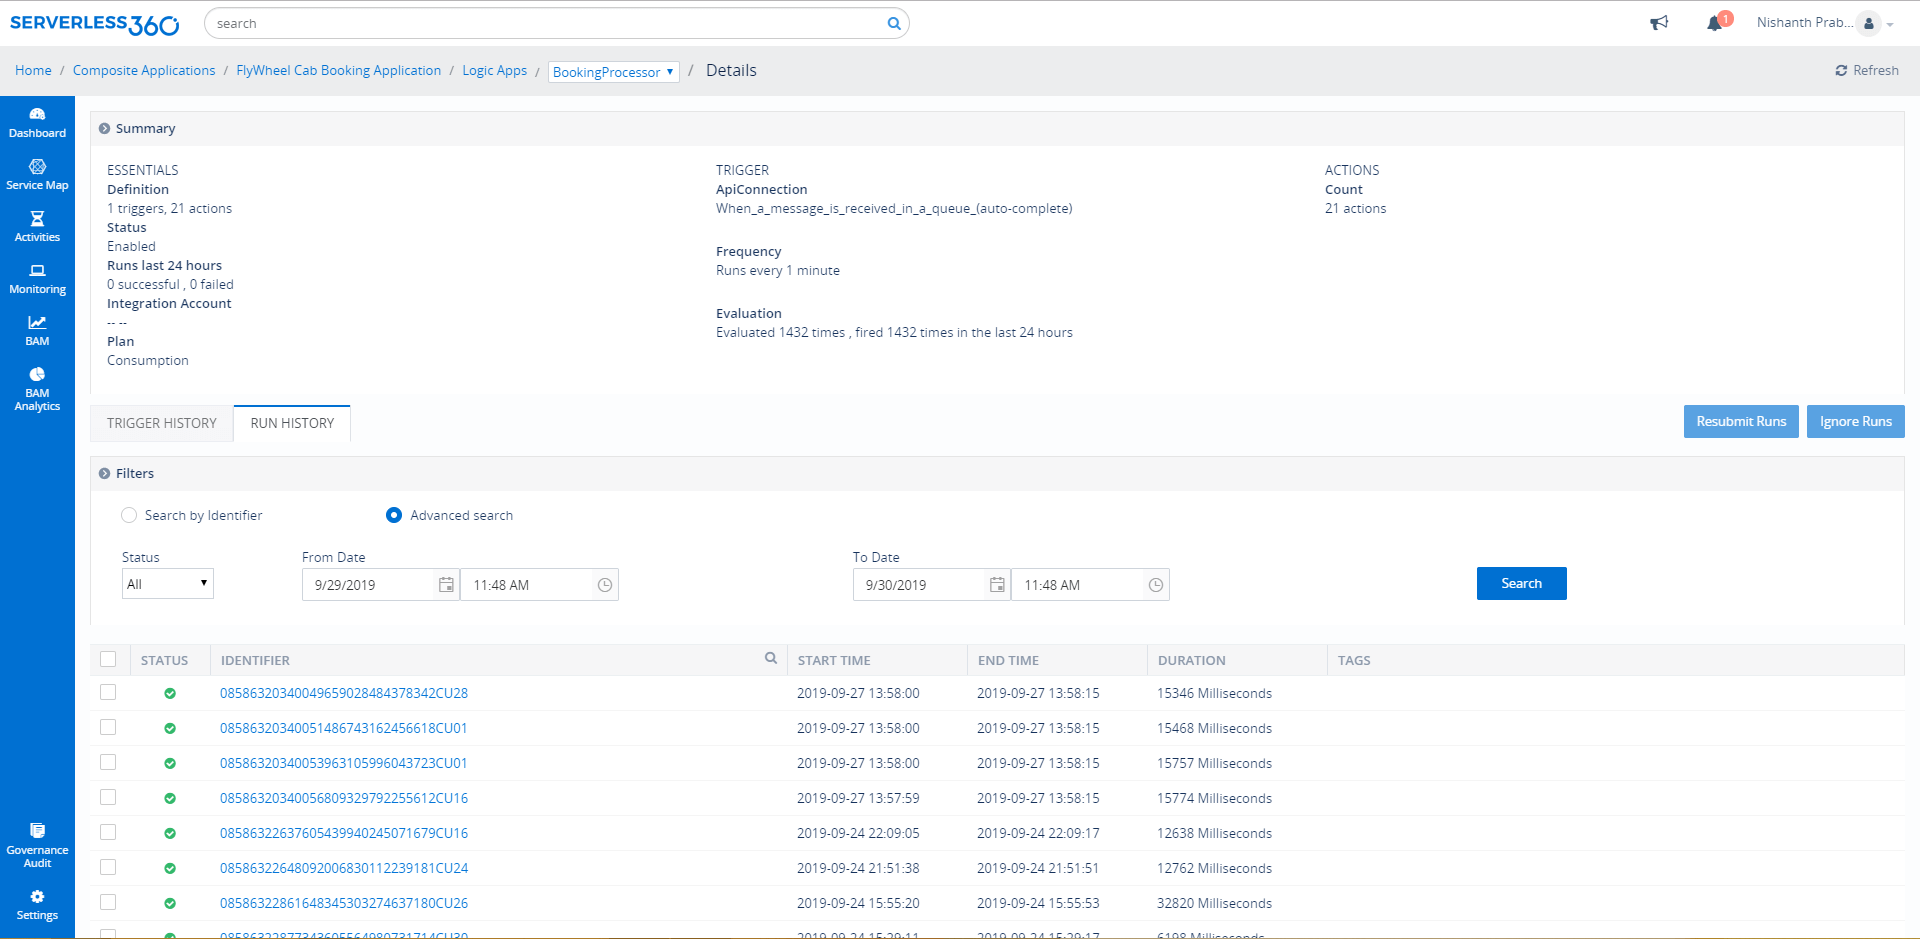
Search run histories
In Turbo360, User can search the run history either by Identifier or with some time bound and status. It is also possible to access the state of a Logic App run and Input/ Output bounds of the Run Actions. Fetching the failed run on a specific date and time and further looking into its input and output bound will be a key feature to have to support effective debugging.
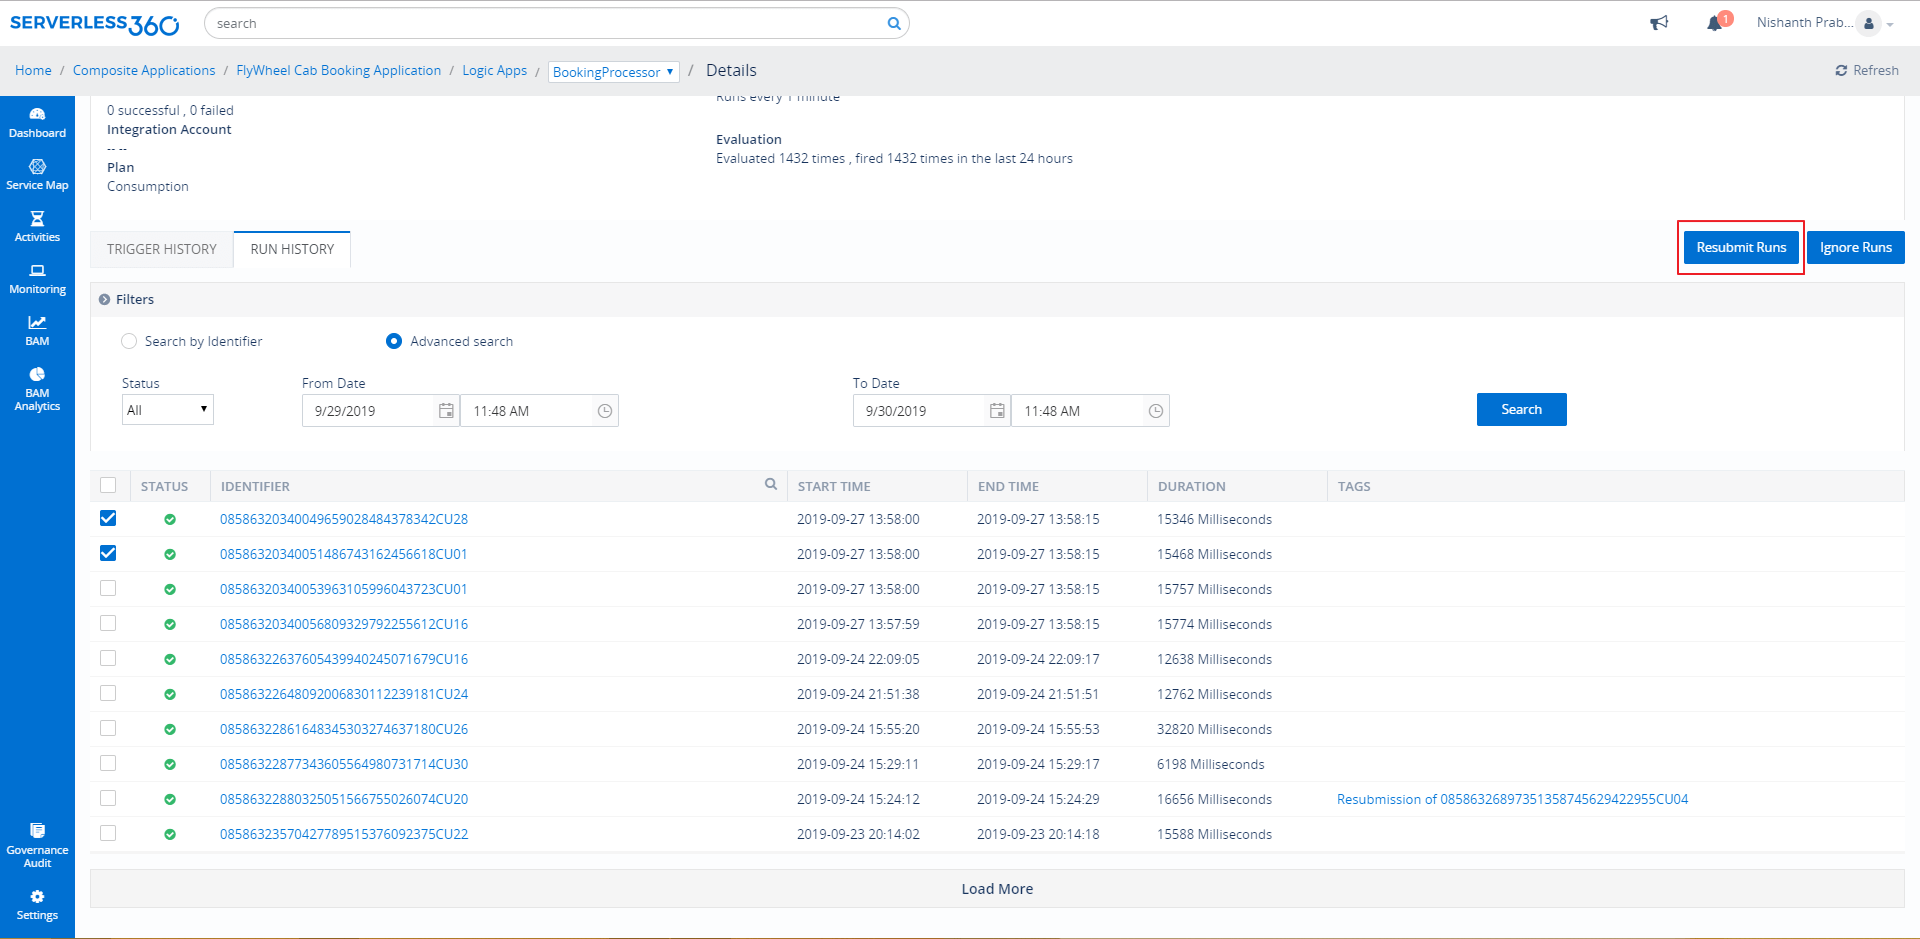
Resubmit runs
There would be a scenario like Logic App runs fail due to the wrong configuration. After changing the Configuration, user would need to test Logic App with the same input. With Resubmission in Turbo360, user can resubmit the Logic App runs and achieve correlation.
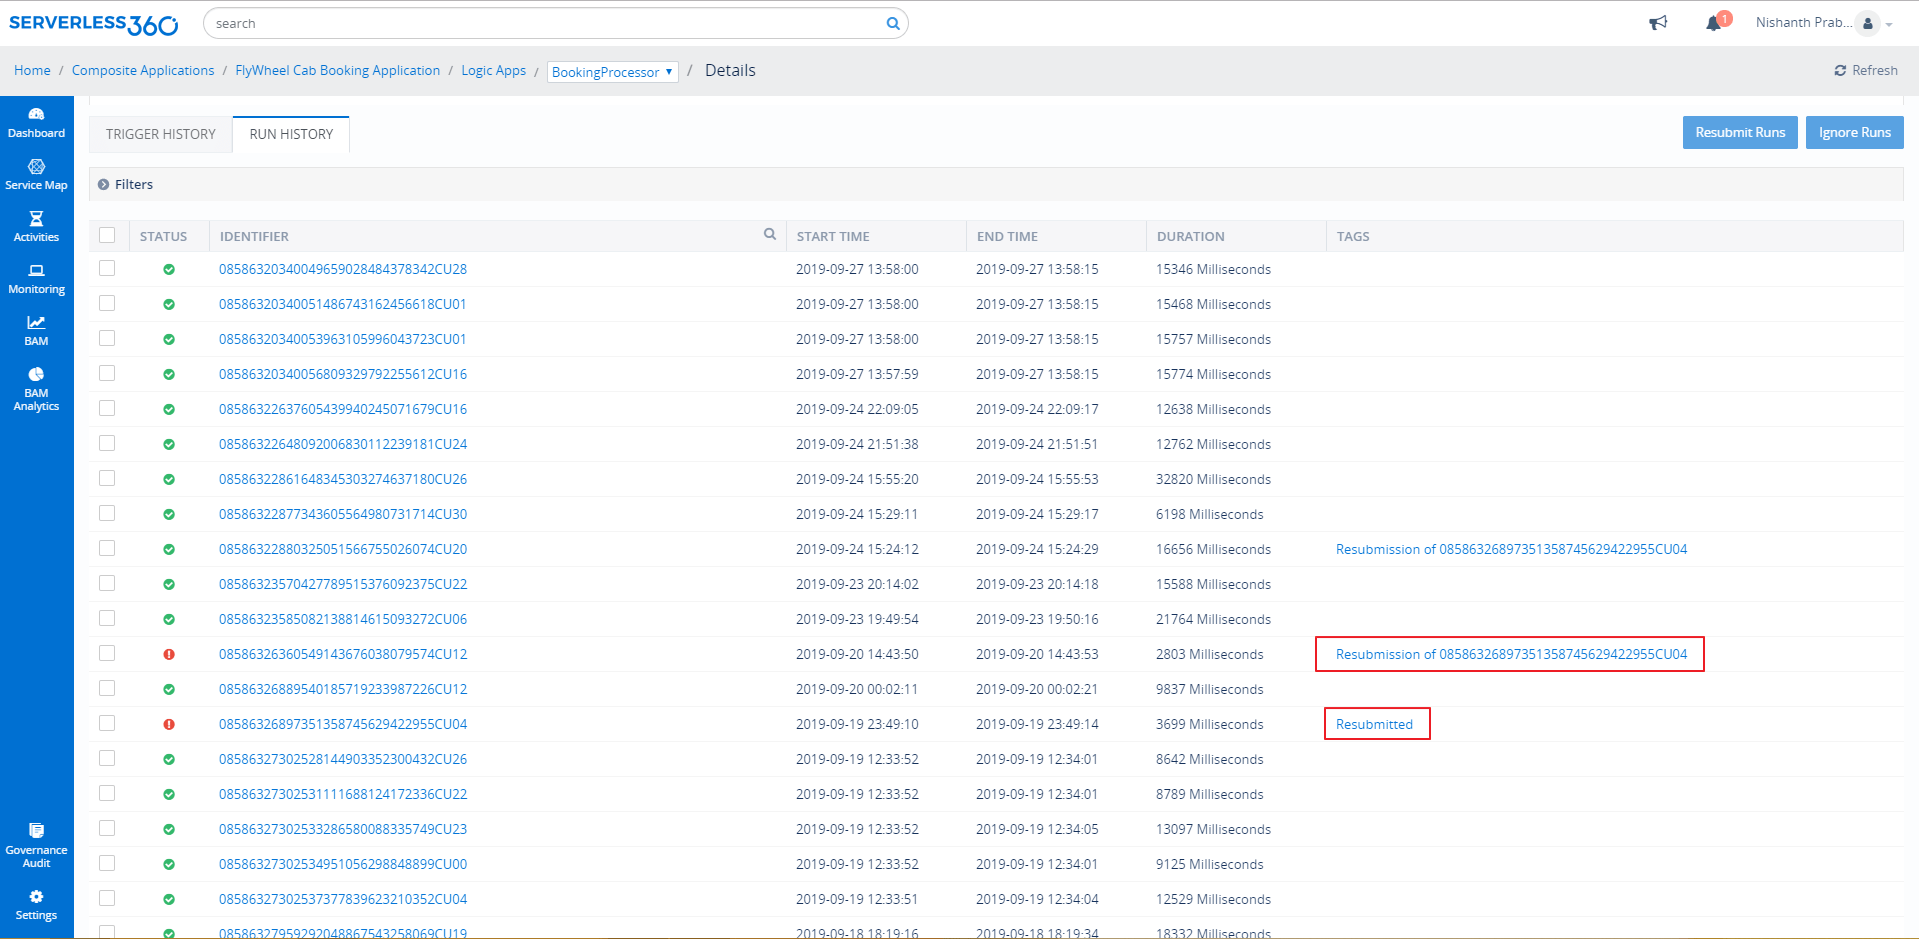
Correlate run resubmission
In Azure portal, user cannot achieve correlation between resubmitted run and parent run but in real-world business scenario, user would need to achieve correlation when there are multiple run records which are interconnected. To overcome this challenge, Turbo360 offers the capability to achieve a correlation between the Resubmitted run and the Parent run. The Resubmitted run will be added with Tag with ID of the parent run and user can investigate the status of the Parent run by clicking on that tag. It is also possible to add the Ignore tag with custom message to inform other users dealing with the Logic App not to do any operations.
Service Map
Consider a Sales person would need to visualize the orchestration and want to know the status of every entity involved in the orchestration. Here comes the Service Map in Turbo360 with which user can create the visual representation of the orchestration and get to view the status of the entities involved in the orchestration as well. The Status of the entities is completely based on the Monitoring configuration done in the monitoring section.
Handle failed Logic App runs efficiently
With Turbo360, user can automate the complex and bulk processes for several entities.
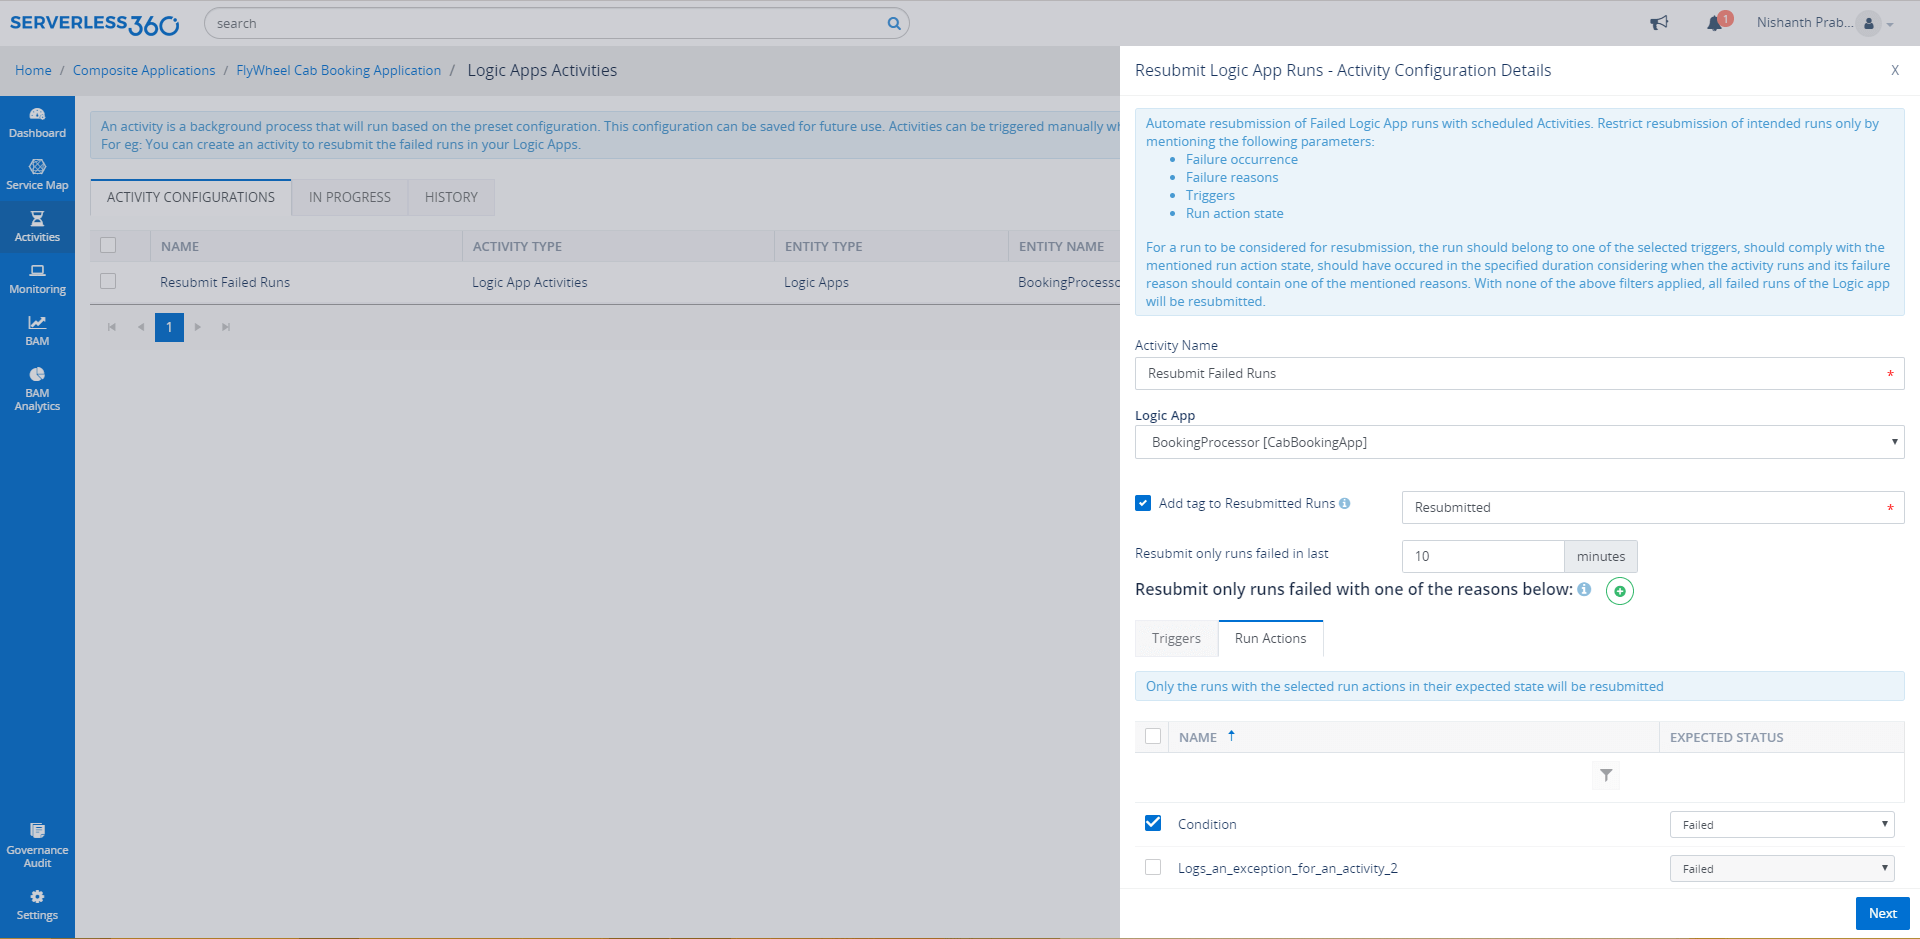
Resubmit Failed runs
Consider the Fly wheel Cab booking Application’s cab booking scenario, where there were multiple failed bookings which need to be resubmitted to complete the transaction. With the Activity in Turbo360, user can automate the resubmission of Failed Logic App runs along with Scheduling. It is possible to set the required context by adding tag. Activity can also be configured to resubmit the failed runs of the selected trigger only.
Business Activity Monitoring
Track the business process and message flow in the orchestration using Business Activity Monitoring in Turbo360
Track Logic App with BAM
With BAM in Turbo360, user can perform end to end tracking of the message flow through the business orchestration built using Azure Logic Apps. With the BAM connectors in Logic App, user can track the message flowing through the stages and transactions of the Logic Apps in a Graphical view. With Exception logging, user can log the custom exception in the business process.
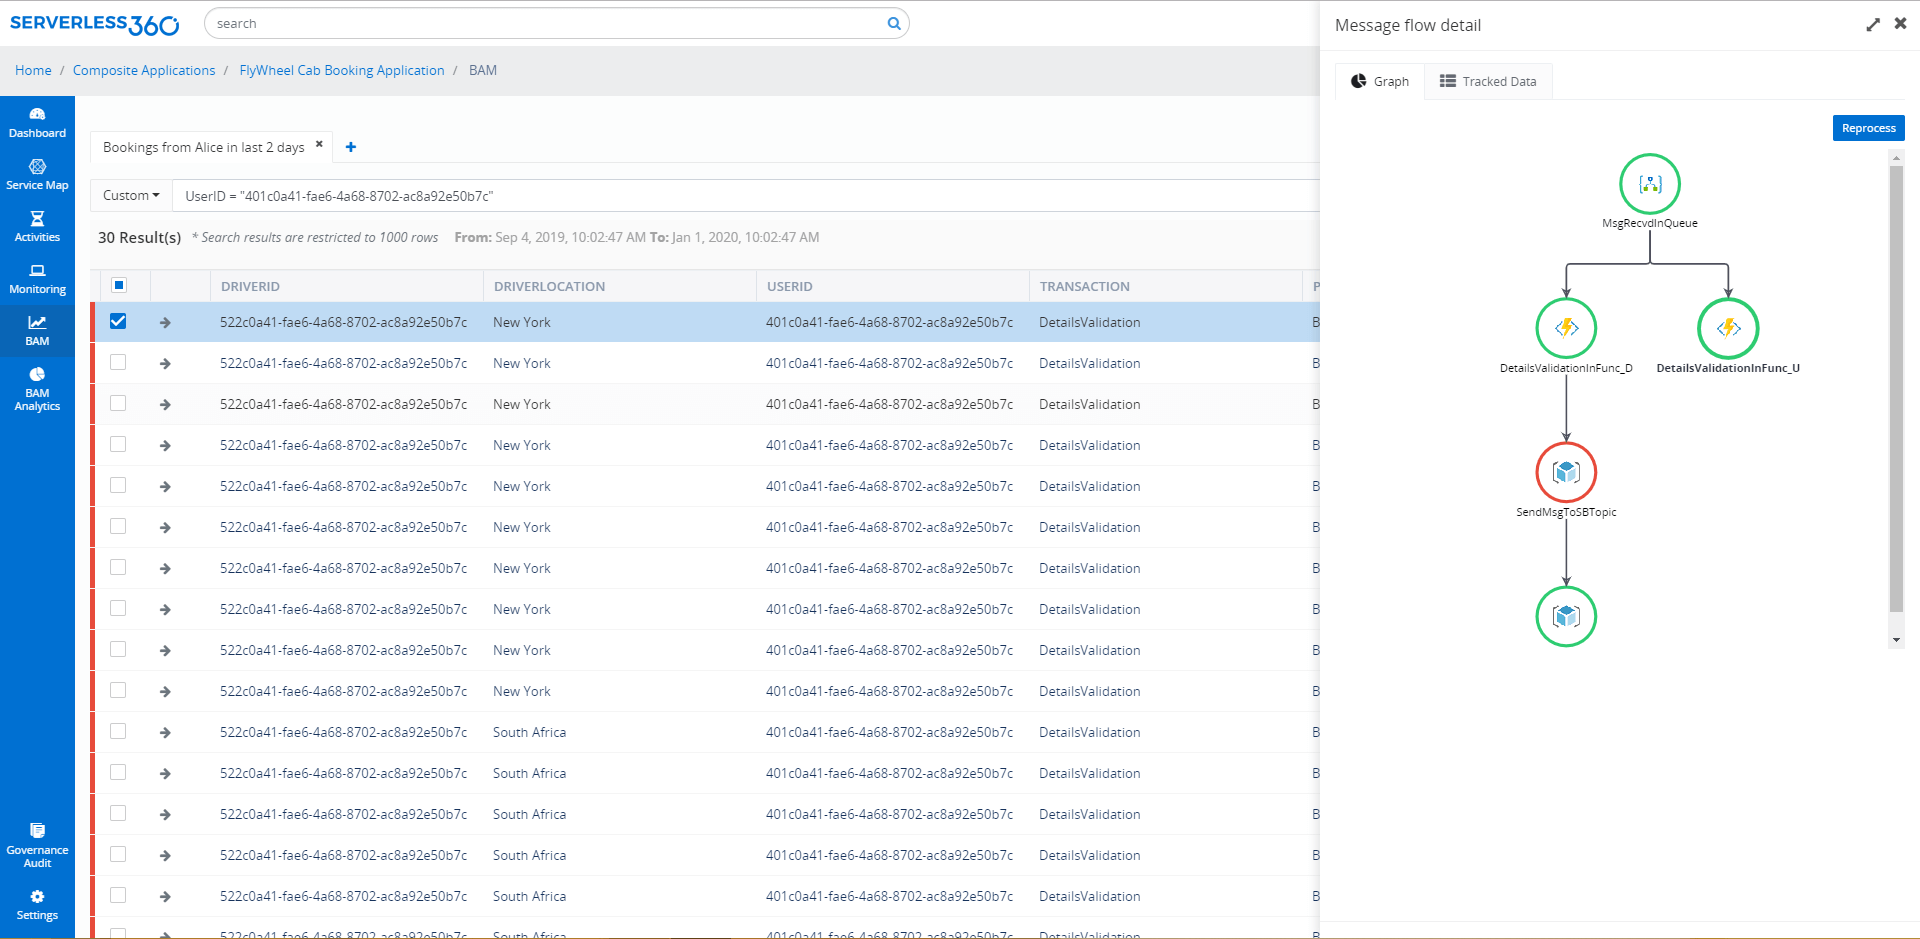
It is also possible to reprocess the failed business process to restore the business. Below is the good read on Business Activity Monitoring in Turbo360.
Monitor Azure Logic App in Turbo360
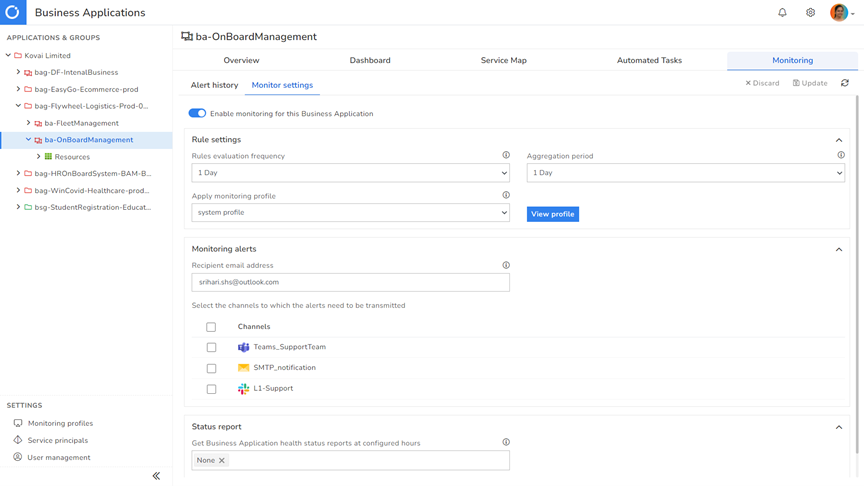
There would be a scenario like user would need to get the status report of the entities for every 2 hours or at the end of the day.
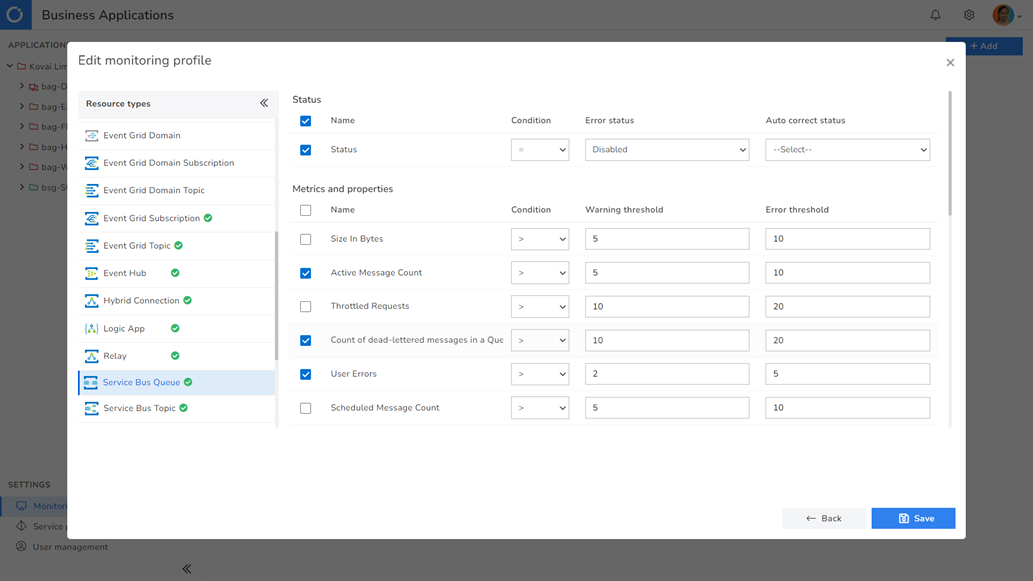
The Product manager of the Cab Booking Application needs to know if the status of the Logic App is Enabled as expected. The need here is a consolidated report on status of all the entities those participate in the application at specified interval say every 4 hours once.
To meet this requirement, user can choose the Status monitor in Turbo360. It monitors the entities based on their status and basic properties. The consolidated report can be received on the configured Notification Channels that Turbo360 supports.
Monitor metrics
The monitoring need of an Architect of the Fly Wheel Cab Booking Application would be different. The Logic App should be monitored in multiple perspectives which would include performance, availability, consumption and so on.
Data monitor in Turbo360 is the best solution that can facilitate monitoring Logic Apps in various perspectives on the extensive set of available Azure metrics. The metrics can be selected based on the monitoring need. Please refer the section 3.3 for quick reference on the available metrics and the monitoring perspective that can be achieved choosing the metric.
Violation Monitor
Consider a DevOps engineer of the Fly Wheel Cab Booking Application, would need to monitor the entities for any violation and needs to be informed as and when the violation occur, here comes the Threshold monitor in Turbo360 to meet this need. In a Threshold monitor, user will configure the violation persist time and number of alerts per violation while creating the monitor. If the violation exists beyond the violation persist time, user will get the alerts.
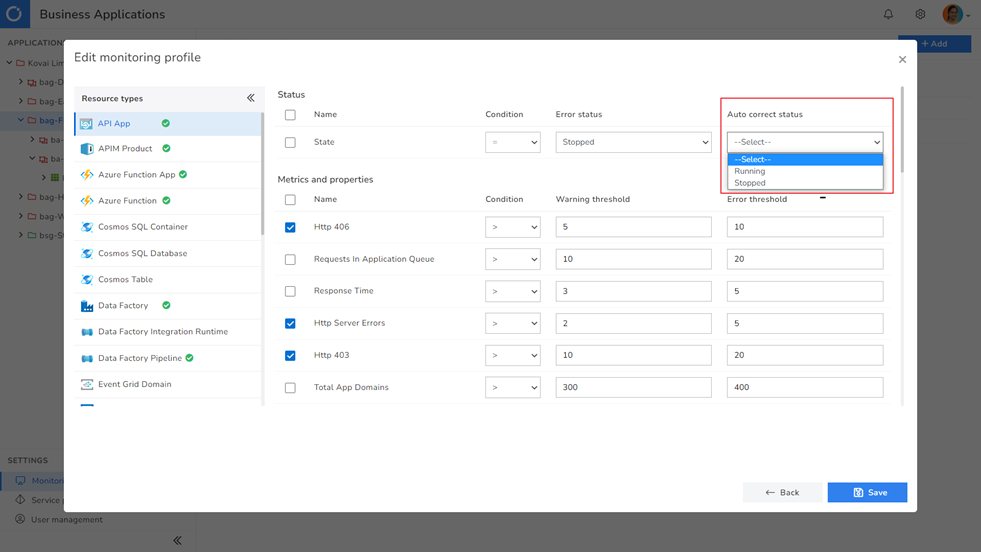
How to automatically monitor your Azure Logic App?
In Turbo360 user can configure the auto correct option on the entity status. Users can configure the expected state and number of retries. Based on the configuration, monitor will automatically correct the state of the entity. Turbo360 also automatically generates system monitoring profiles once you sign up for the tool. This feature reduces the time taken to configure the monitoring profiles and is automatically available in the tool to monitor your resources.
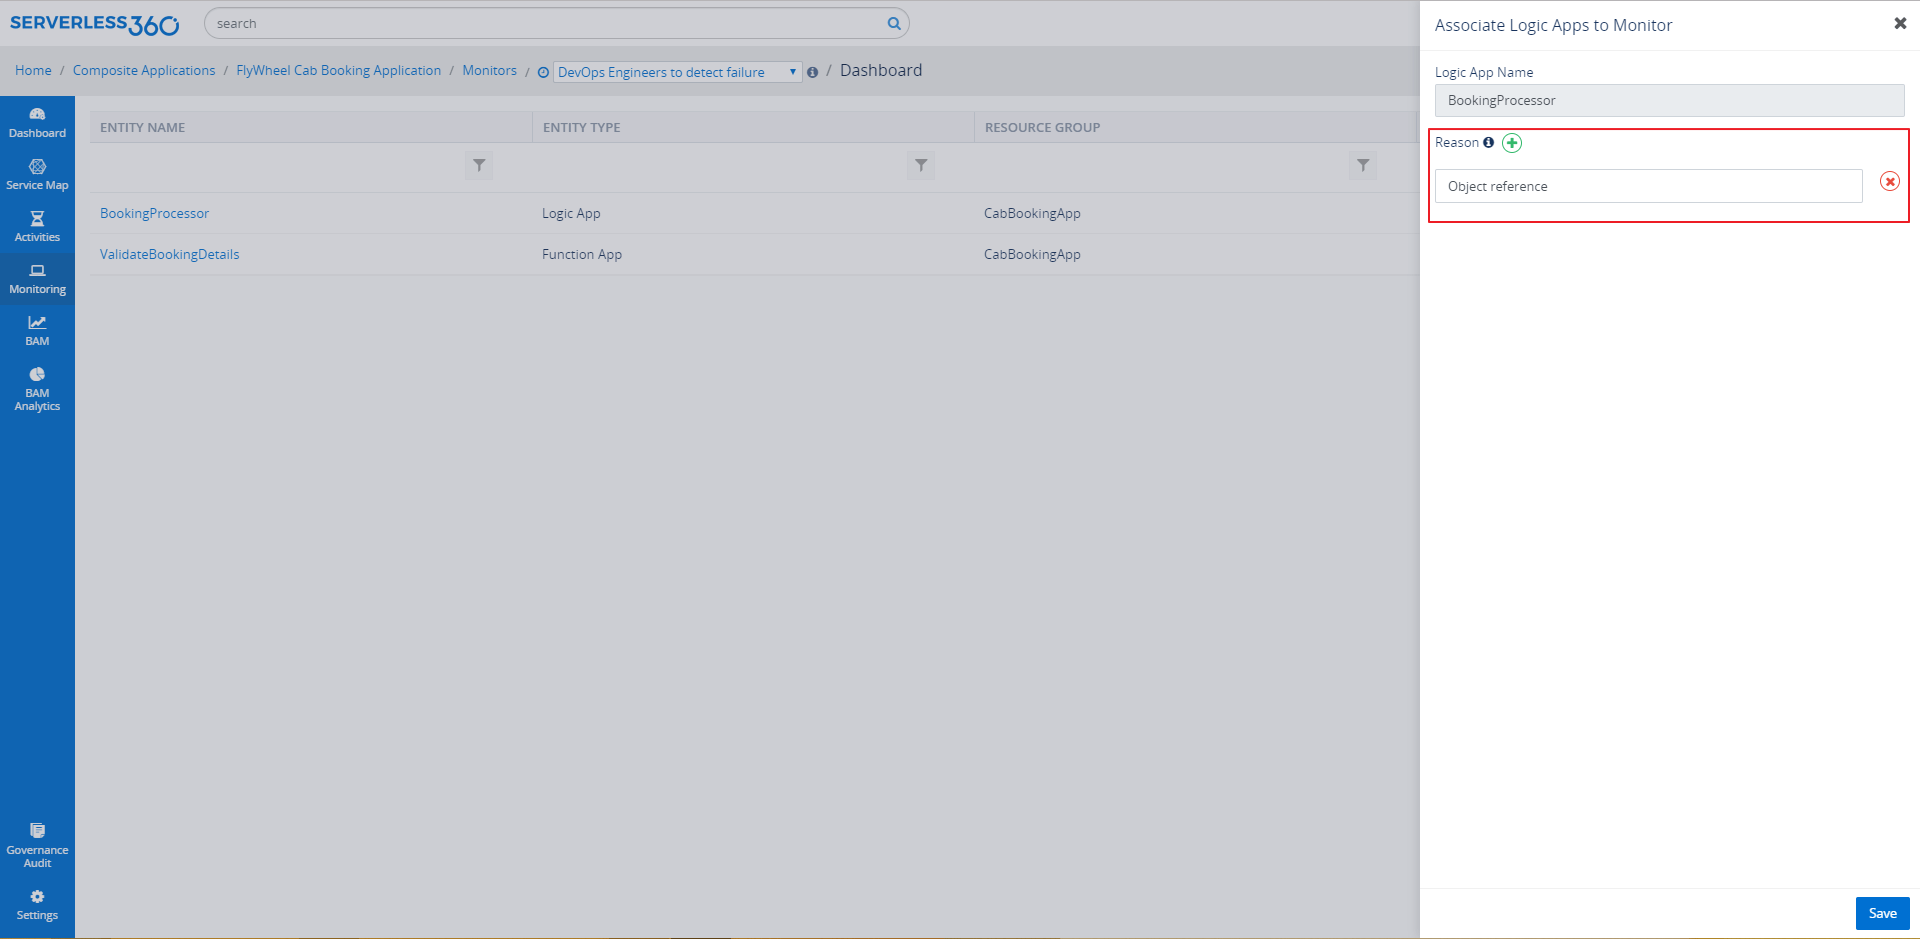
Detect Failures
Consider a developer would need to detect any failure in Logic App trigger or run. With Watch monitor in Turbo360, developers can detect the failure in trigger or run history of Logic Apps within the specified duration which can be as low as 5 mins. With Watch Monitor, User can also monitor based on Error reason of a Logic App run.
Watch this webinar video that covers in detail about the capabilities of Turbo360 to facilitate managing and monitoring Azure Logis Apps. All concepts are dealt with real-world business use cases for better understanding.
This content will be continuously revamped to stay up to date.
Turbo360 helps to streamline Azure monitoring, distributed tracing, documentation and optimize cost.
Sign up NowFrequently Asked Questions
-
When to use Azure Logic Apps?
Logic Apps helps you coordinate the flow of data through disparate systems. Logic Apps works best when you’re integrating multiple services with some added control logic. For example, Social Media Monitor, Cab Booking Application, Video Archive Utility and Direct Online Sales are places where Logic Apps usage would be an ideal choice.
-
What are tracked properties in a Logic App?
You can add a trackedProperties section to an action either using the Logic App Designer or manually in your logic app’s JSON description to track inputs or outputs in diagnostics data. Tracked attributes can only track the inputs and outputs of a single action, while the correlation properties of events can be used to correlate across actions in a run. Add the trackedProperties section and the properties you wish to track to the action definition to track more than one property, one or more properties.
-
How do I know my Logic App is running?
Select Overview in your logic app. All past, current, and any pending runs for your logic app appear in the overview pane under Runs history. If there are a lot of runs in the list and you can’t find the one you want, consider filtering it.
-
What is data retention in Logic Apps?
Data retention in logic apps is set to 90 days by default. If not effectively managed, the expense of data retention might grow rapidly. Unless you have a business need to maintain the run history of your logic apps, I recommend lowering the Data retention to the lowest option available, which is 7 days.
-
How do you deploy Logic App templates?
To automatically deploy a logic app template to Azure, you can choose the following Deploy to Azure button, which signs you in to the Azure portal and prompts you for information about your logic app. You can then make any necessary changes to the logic app template or parameters.
-
How do you pause Azure Logic App?
You can use the built-in Delay – Schedule action before an action in your logic app’s workflow to have your logic app wait a certain length of time before performing the next action. You may also use the built-in Delay until – Schedule action to delay the next action until a given day and time.
