Introduction
This article will focus on using Azure Application Insights to monitor real-world business apps. Azure Application Insights is an Application Performance Management (APM) service for developers and DevOps professionals. It is used to monitor an app that is live in real time.
It supports a variety of platforms, including .NET, Node.js, Java, and Python hosted on-premises, hybrid, or any public cloud. Application Insights can be used in two ways to monitor your Application. They are,
- Codeless Monitoring
- Code-based Monitoring
What Can Be Monitored?
Azure Application insight is ideal for developers to monitor how an application works in real time, from performance to error logs. As an APM tool, it can monitor
- Request rates, response times, and failure rates
- Exceptions
- Pageviews and load performance
- Diagnostic trace logs
- Custom events and metrics and many more
Users can achieve all the above-mentioned monitoring goals with the help of tools in Application insights like Application Map, Live Metrics, Dashboards, etc.,
Codeless Monitoring
In Codeless Monitoring, Users can get to monitor the Application without any modification to the code, provided the application is hosted in an Azure Service like Azure Web App or Azure Virtual Machine. These resources are natively integrated with the Application Insights that can be enabled from the Azure portal itself. Now let us see how to enable Azure Application insights for an Azure Web App
How Do You Implement Application Insights in Web API?
-
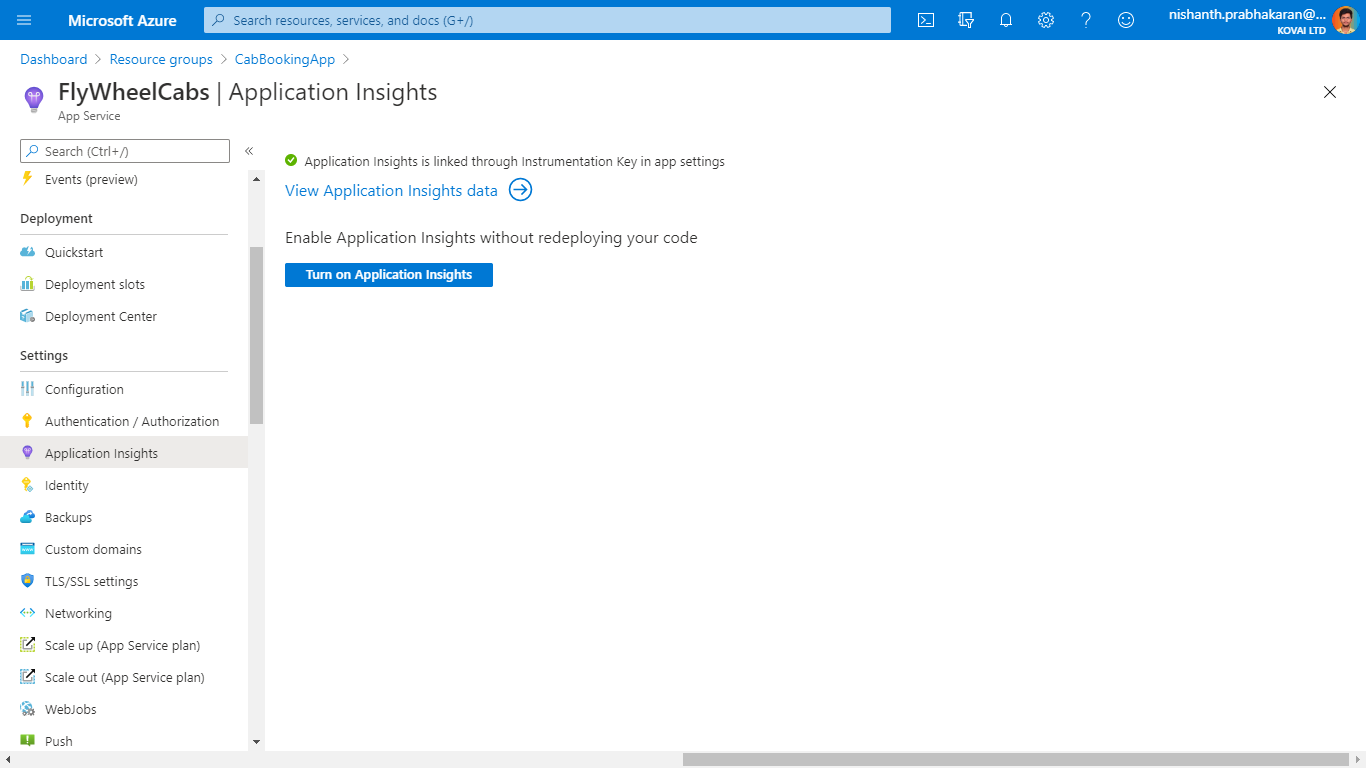
- Go to your Azure Web App -> Application Insights
- Click Turn on Application insights.
-
- You can either choose the existing Application Insights instance or create a new one by providing the Name and Location. And Click on Apply to turn on the Application Insights for this Web-App.
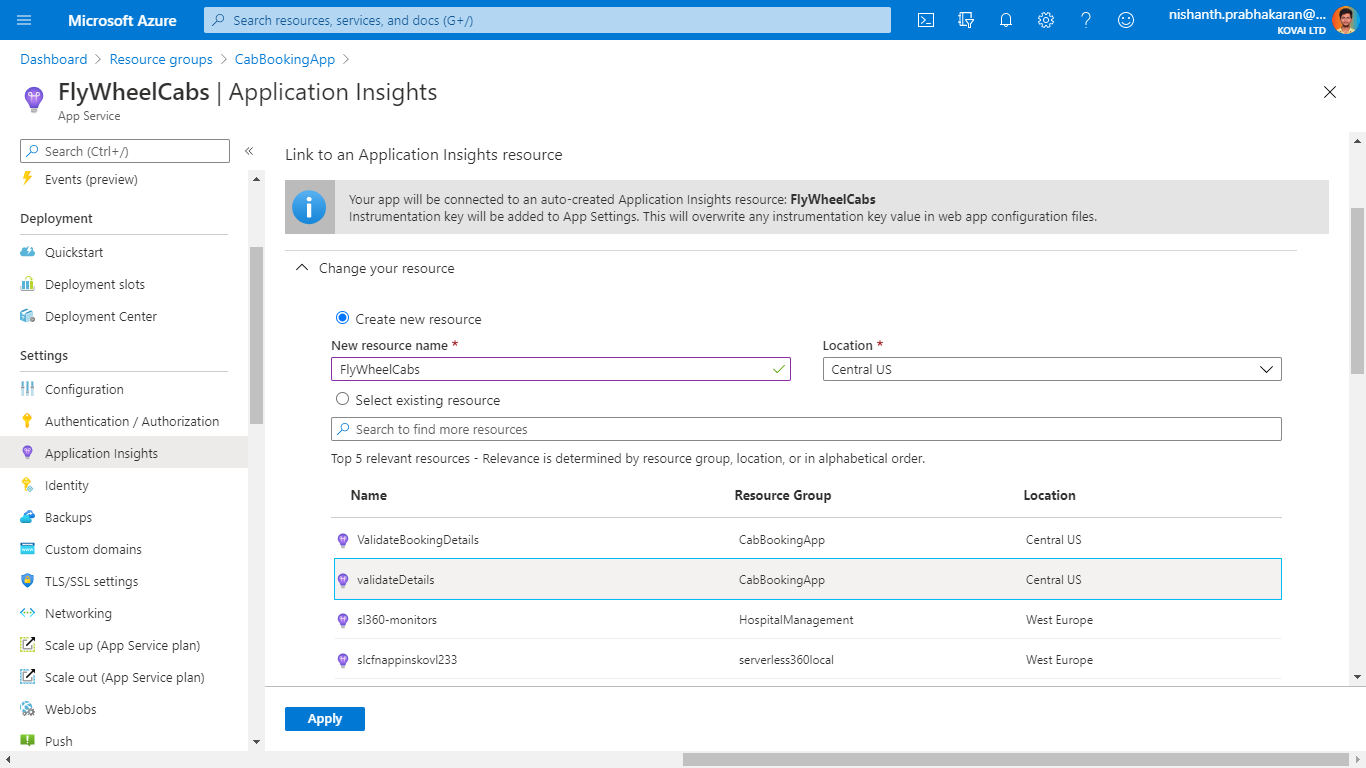
The Web app will now be enabled with the Application Insights, and the user can achieve monitoring goals like live monitoring and failure detection.
Code-based Monitoring
Codeless Application monitoring will be very useful if the application is hosted in Azure Resources like VMs and App Services. Whereas, if the Application is hosted in any other Cloud Service provider or hosting service, then code-based monitoring will be the go-to option. With this monitoring solution, it is possible to monitor the applications or APIs built using
- ASP.NET Core
- ASP.NET Framework
- JAVA
- Python
- Node.JS runtime
With the help of Application Insights Logging, it is also possible to monitor background services and Client-side JavaScript with the help of Application Insights. Now let us take a .NET Core application and see how to integrate Application Insights.
How do I enable Application Insights in Azure?
-
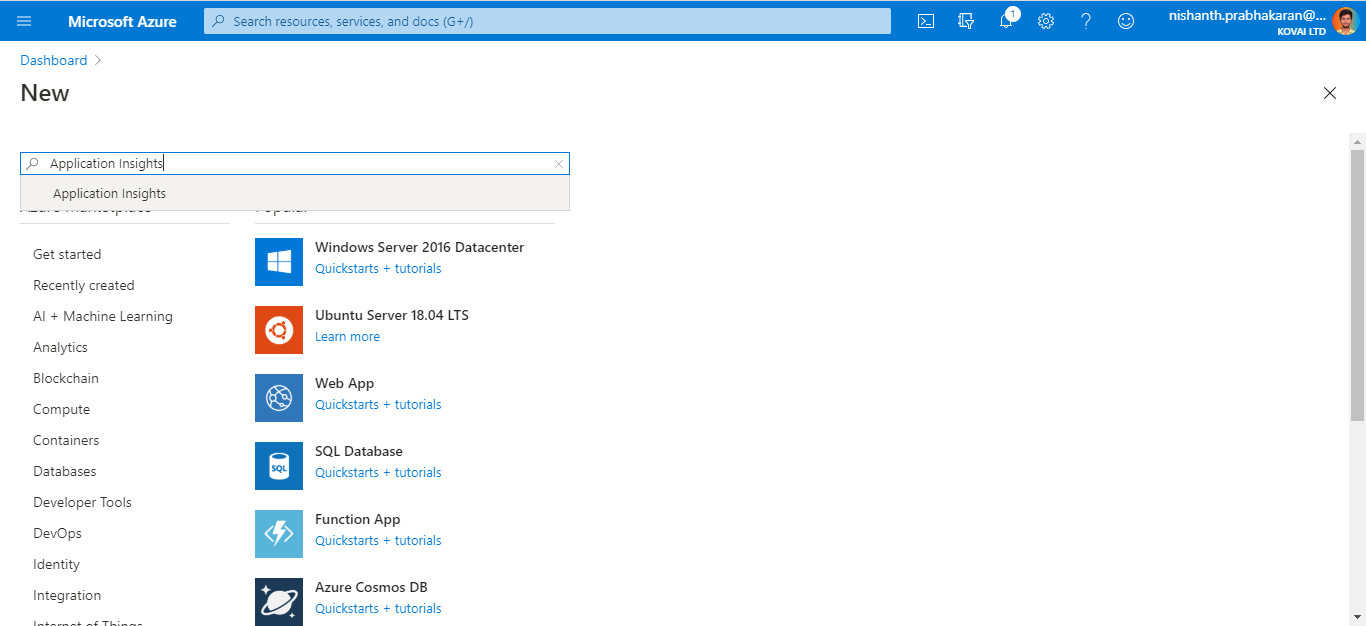
- Create an Azure Application Insights instance in Azure Portal. To create it, click on Create a Resource menu in the left Navigation and Type Application Insights in the Search box.
-
- Now, Give the Name and other details like Resource Group Name, etc., Click Create
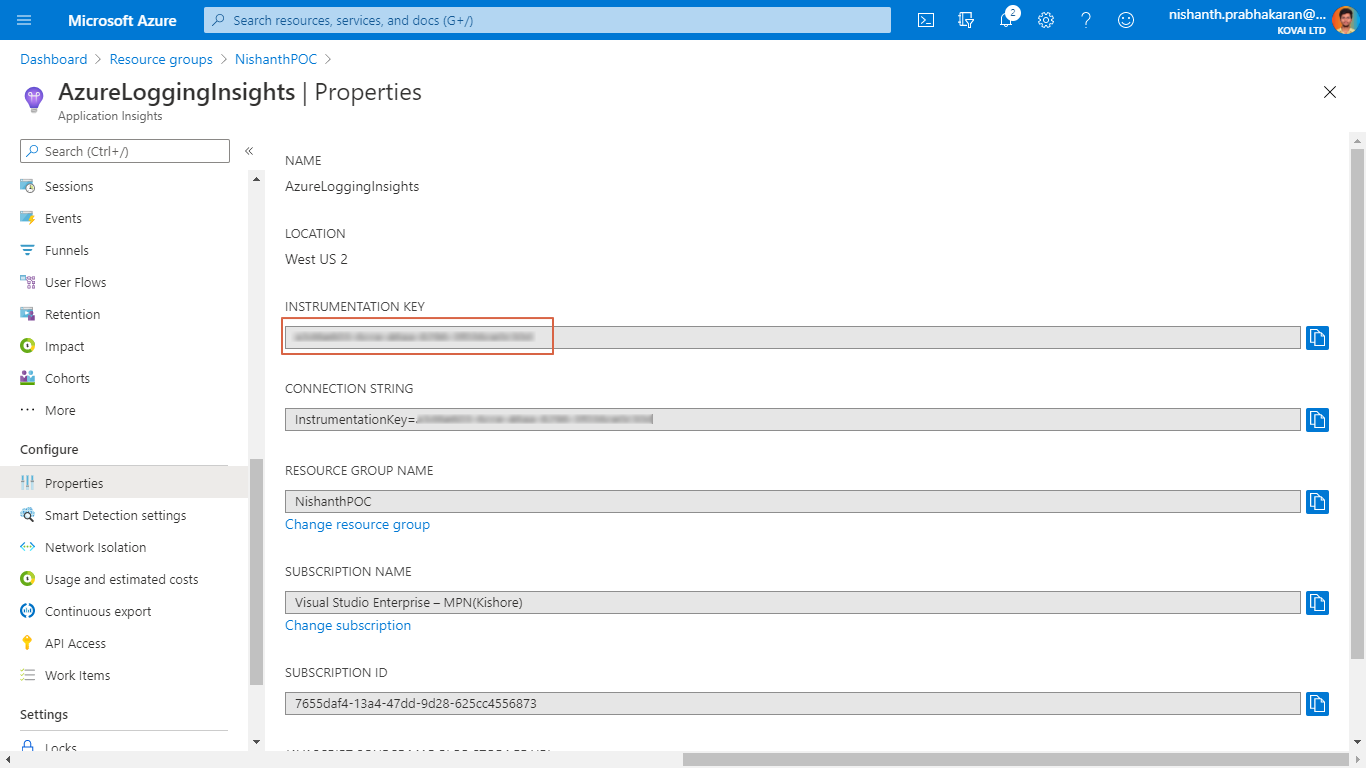
- Once the Application Insights instance is created, go to Properties in the left side navigation bar to get the Instrumentation key that will be required for our Application to establish the connection
-
- Open your .NET Core Application and install the library “ApplicationInsights.AspNetCore” from NuGet Package.
- Add AddApplicationInsightsTelemetry(); to the ConfigureServices() method in your Startup class
// This method gets invoked by the runtime. Use this method to add services to the container.
    public void ConfigureServices(IServiceCollection services)
    {
        // The following line enables Application Insights telemetry collection.
        services.AddApplicationInsightsTelemetry();

        // This code adds other services for your application.
        services.AddMvc();
    }
-
- To establish a connection between the Application and the Azure Application Insights, we need to provide the Instrumentation key in json as an Environment variable as below
{
      "ApplicationInsights": {
        "InstrumentationKey": "< Application Insight Instrumenation – Key >"
      },
      "Logging": {
        "LogLevel": {
          "Default": "Warning"
        }
      }
    }
-
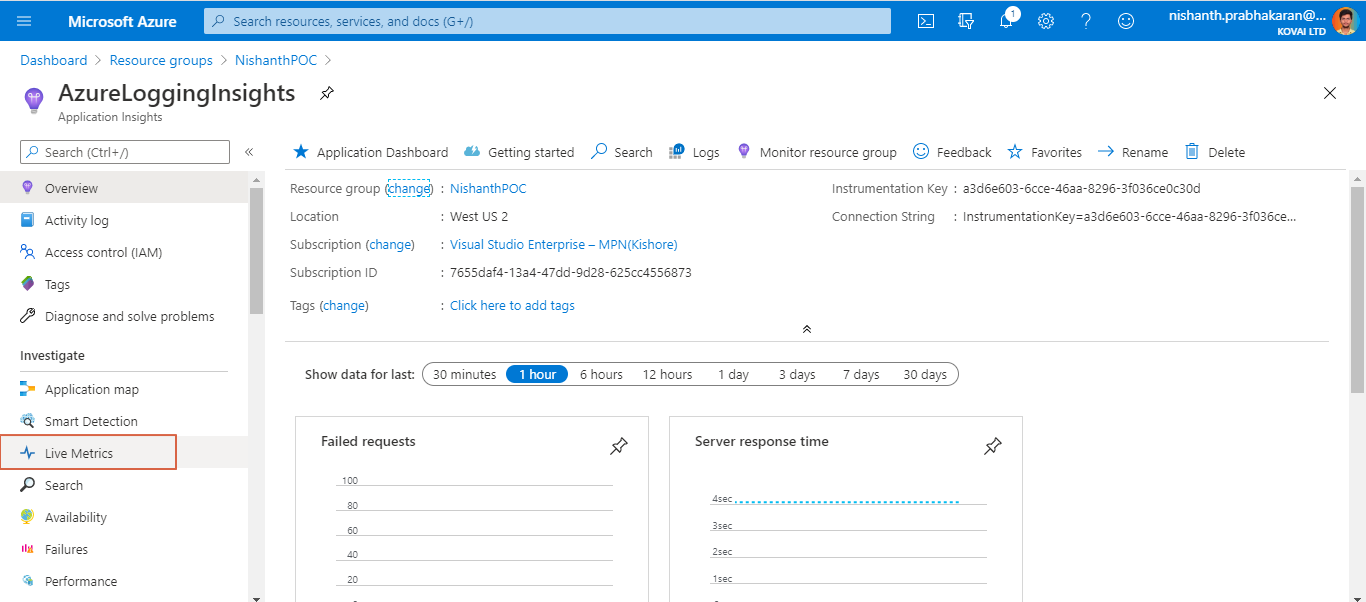
- Now, run the Application. Go to the Application Insights instance that was created in the Azure Portal. Go to Live Metrics in the Left Navigation bar.
-
- Live Monitoring is on, and you can infer the Application performance from the widgets on key performance indices.
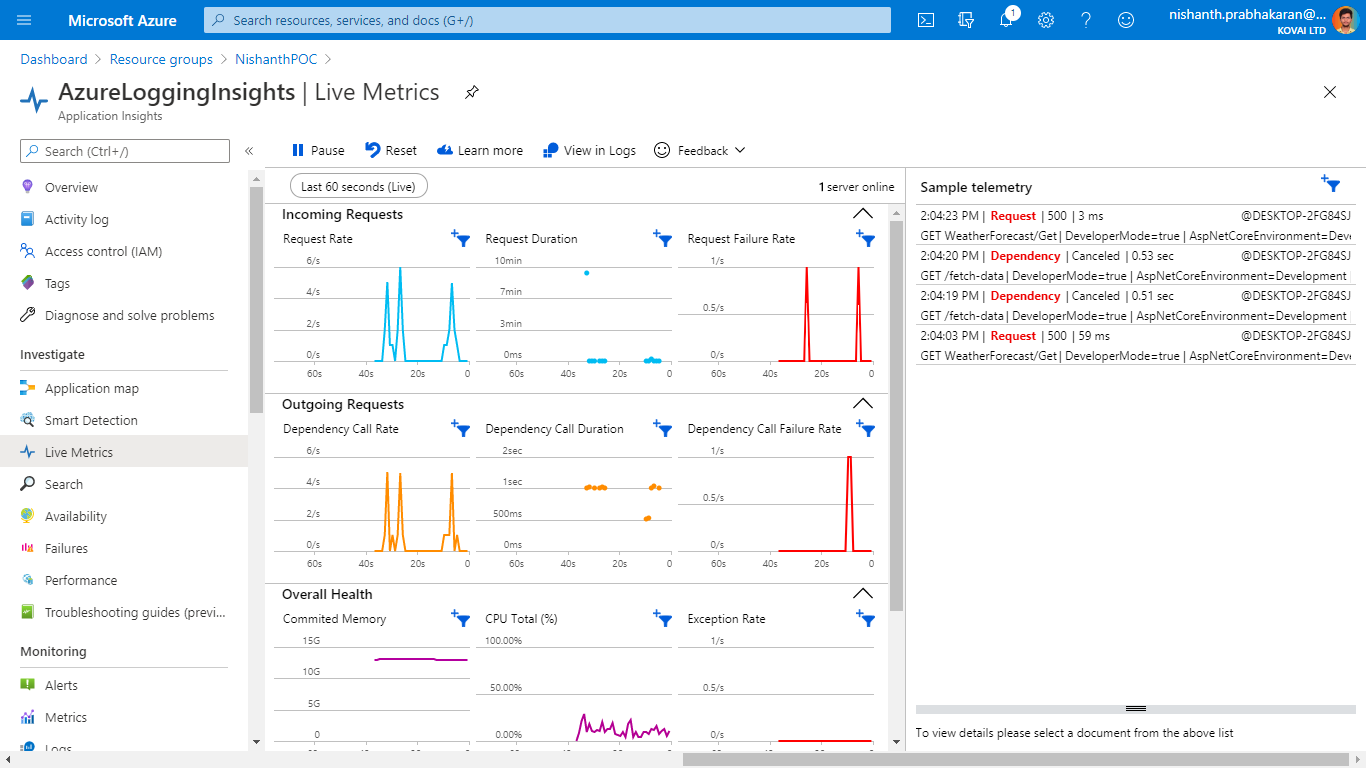
With the help of Live Monitoring, it is possible to monitor a variety of Metrics like Request rate, Request Failure rate, Outgoing requests, Failed Requests, and many more.
How do I perform logging for exceptions in Application Insights?
By configuring the Application as mentioned above, the user can monitor all the requests and logs sent to Azure Application insights. But when the need is to monitor only the logs which are in the Warning or Error state, it can be achieved by filtering the Log information based on Severity as mentioned below
To filter the logging data, the user must create a builder in the CreateWebHosting() method and add a filter as below code:
//Program.cs
public class Program
{
    public static void Main(string[] args)
    {
        CreateWebHostBuilder(args).Build().Run();
    }

    public static IWebHostBuilder CreateWebHostBuilder(string[] args) =>
      WebHost.CreateDefaultBuilder(args)
        .UseStartup()
      .ConfigureLogging(
            builder =>
            {
                builder.AddApplicationInsights("ikey");
        builder.AddFilter
                                 ("", LogLevel.Warning);
            }
        );
}

Once the filtering has been set, the user can log the necessary information from the Controller as below
//ValuesController.cs
public class ValuesController : ControllerBase
{
    private readonly ILogger _logger;

    public ValuesController(ILogger logger)
    {
        _logger = logger;
    }

    // GET api/values
    [HttpGet]
    public ActionResult<IEnumerable> Get()
    {
        using (_logger.BeginScope(new Dictionary<string, object> { { "MyKey", "MyValue" } }))
            {
                _logger.LogWarning("An example of a Warning trace..");
                _logger.LogError("An example of an Error level message");
            }
        return new string[] { "value1", "value2" };
    }
}
It is also possible to log the data from our logging services by providing the necessary information. This Azure Application Insights Logging can be useful when the need is to monitor the performance of an Application.
How do I see exceptions in Application Insights?
Open the Application Insights Search window in Visual Studio, and set it to display events from your app. While you’re debugging, you can do this just by clicking the Application Insights button. Notice that you can filter the report to show just exceptions.
Users can even use the application insights created in Azure Portal to view all the errors happening in their system.
How do I view App Insight Logs?
In the Azure portal, browse to the required resource group and select the required resource like Function App, Web App, etc.,
In the monitoring section, select the logs option and all the logs captured will be displayed.
But When the Application comprises a variety of Azure Serverless Resources and the need is to monitor the whole Application along with Azure resources, Application Insights Logging cannot be the right solution for this scenario.
Here comes the Business activity monitoring in Turbo360 to perform end to end tracking on Azure Serverless Applications.
Achieve Distributed Tracing with Business Activity Monitoring
Business Activity Monitoring in Turbo360 is a tool to perform end to end tracking of the Azure Serverless applications. Turbo360 BAM can be instrumented in your business application using the Exposed APIs also available as .Net SDK and Logic App Connector. Implementing Business Activity Monitoring can provide visibility on the messages flowing through the components of the business application with distributed tracing.
Business Transactions
Every Transaction of an Application will be tracked in a separate section where the status of the transactions can be viewed along with the status of each stage in a transaction.
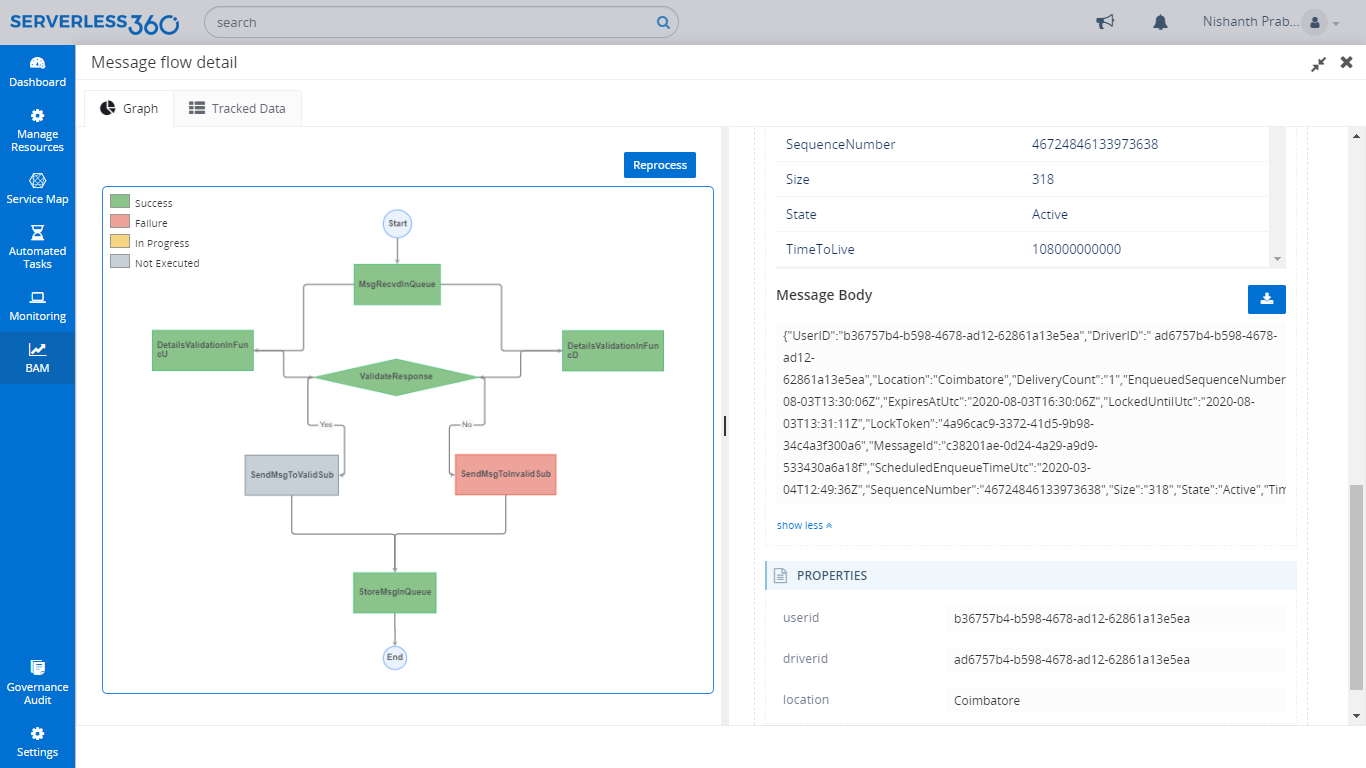
It is also possible to view the data flowing through every stage along with the tracking of key business properties.
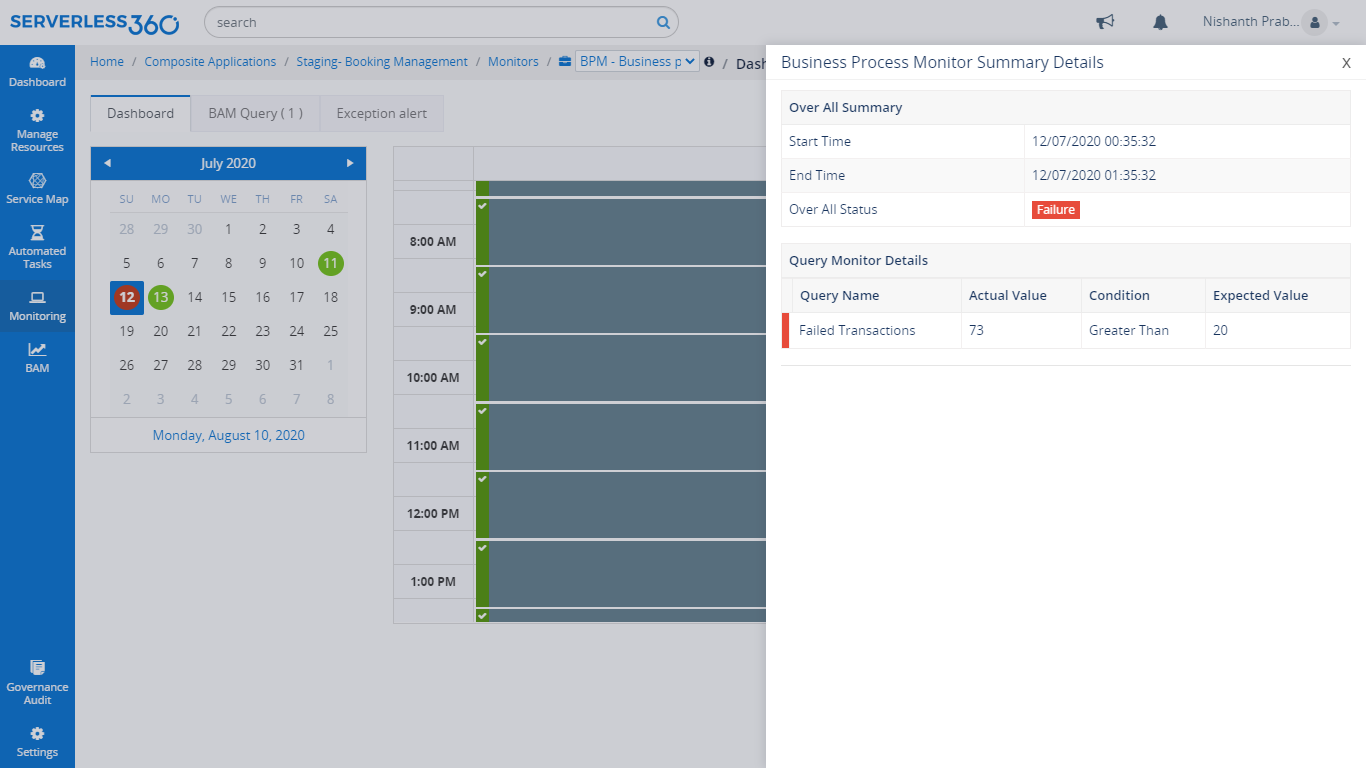
Analytics & Monitoring
Business Activity Monitoring in Turbo360 also offers the capability to monitor the transactions when there is a failure or exception. Users will be notified through the configured Notification channels whenever there is an exception in any of the Business transaction. Calendric view in Business process monitor helps to understand transaction monitoring history.
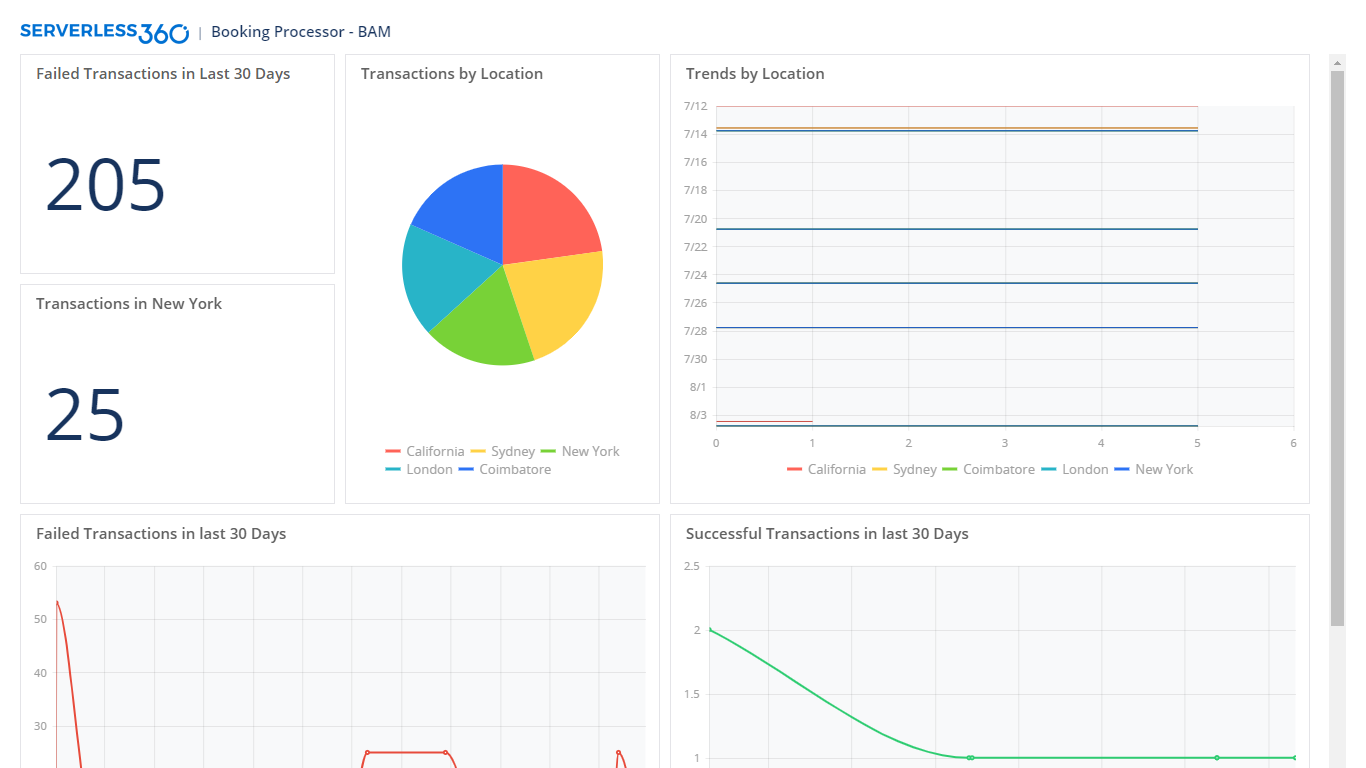
Consider when there is a need to analyse how the application is performing based on the custom property tracked. Turbo360 Dashboard helps the user to create widgets and analyze business transactions in a graphical view. User can give the input as a BAM query and get the data as advanced graphical widgets as below
Summary
Application Insights along with Logging is the best tool for live monitoring of Applications much needed for developers, whereas it is too complex for an operations or support user. Their need would be a tool like Turbo360 to monitor and track the whole Serverless Application with better monitoring and management capabilities. To know more about Turbo360 on how it is better compared with other monitoring solutions offered by Azure, Follow the Links below