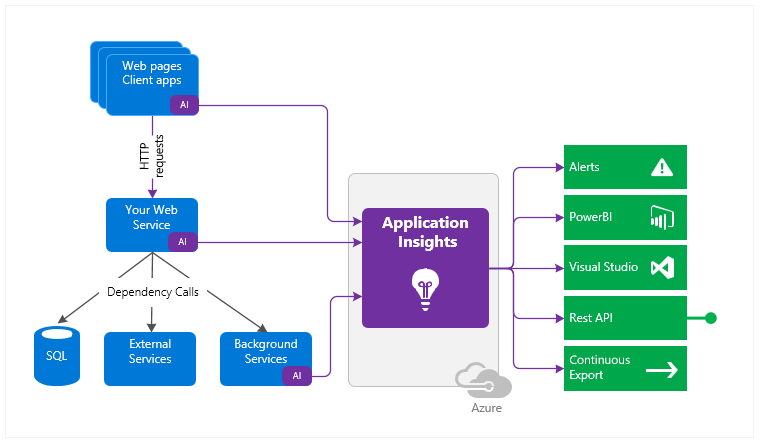
What is Application Insights?
Application Insights is used to monitor your live applications. It automatically detects performance anomalies. It also helps you to diagnose issues with the help of powerful analytics tools and to understand what users do with your app. The aim of development team is to help you understand how your app is performing and how it is being used by the customers.
What Is Telemetry in Application Insights?
Application Insights telemetry model defines a way to correlate telemetry to the operation of which it’s a part. For example, a request can make a SQL Database calls and recorded diagnostics info. You can set the correlation context for those telemetry items that tie it back to the request telemetry.
How Do Application Insights Work?
Users can install a small instrumentation package (SDK) in their application or enable Application Insights code-less. The instrumentation monitors your app and directs the telemetry data to an Azure Application Insights Resource using a unique GUID which we refer to as an Instrumentation Key. You can instrument the web service application, any background components, and the JavaScript in the web pages automatically. The application and its components can run anywhere – it is not mandatory to be hosted in Azure.
Track Custom Events with Application Insights
Azure Application Insights SDKs track incoming HTTP requests automatically and call the dependent services, such as SQL queries and HTTP requests. Tracking and correlation of requests and dependencies give an insight into the application’s responsiveness and reliability across all microservices that combine this application.
A certain class of application patterns cannot be supported generically. Proper monitoring of such patterns requires manual code instrumentation.
This document guides how to track custom operations with the Application Insights SDK.
In the Application Insights .NET SDK, the operation is described by the abstract class OperationTelemetry and its descendants RequestTelemetry and DependencyTelemetry.
Events Tracking
The Application Insights web SDK automatically collects HTTP requests for ASP.NET applications that run at an IIS pipeline and all ASP.NET Core applications. If the application is not supported by any of the standard or community-supported solutions, you can instrument it manually.
Let’s see how such operations could be tracked.
On a high level, the task is to create RequestTelemetry and set known properties. After the operation is finished, you can track the telemetry. The following example demonstrates this task.
In Azure, create a Resource Group, and then create an Application Insights resource.
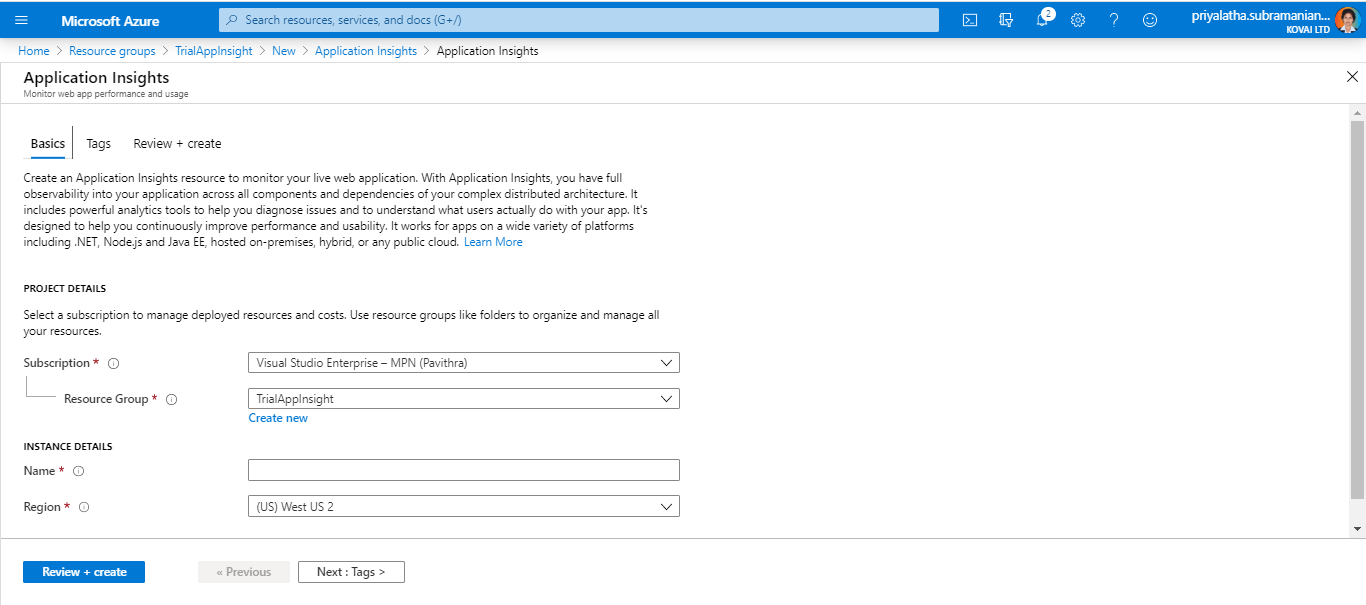
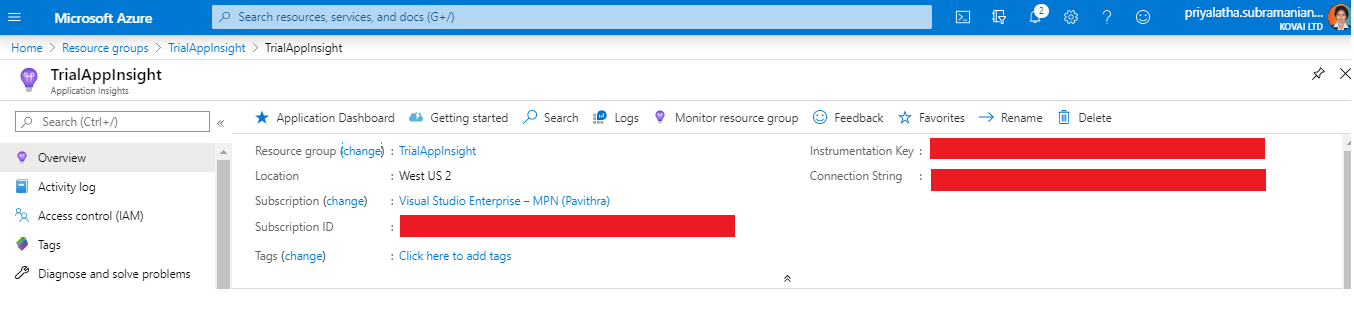
In the Azure Portal, navigate to your Application Insights resource and copy the Instrumentation Key, which is provided at the top right corner and save it for later use.
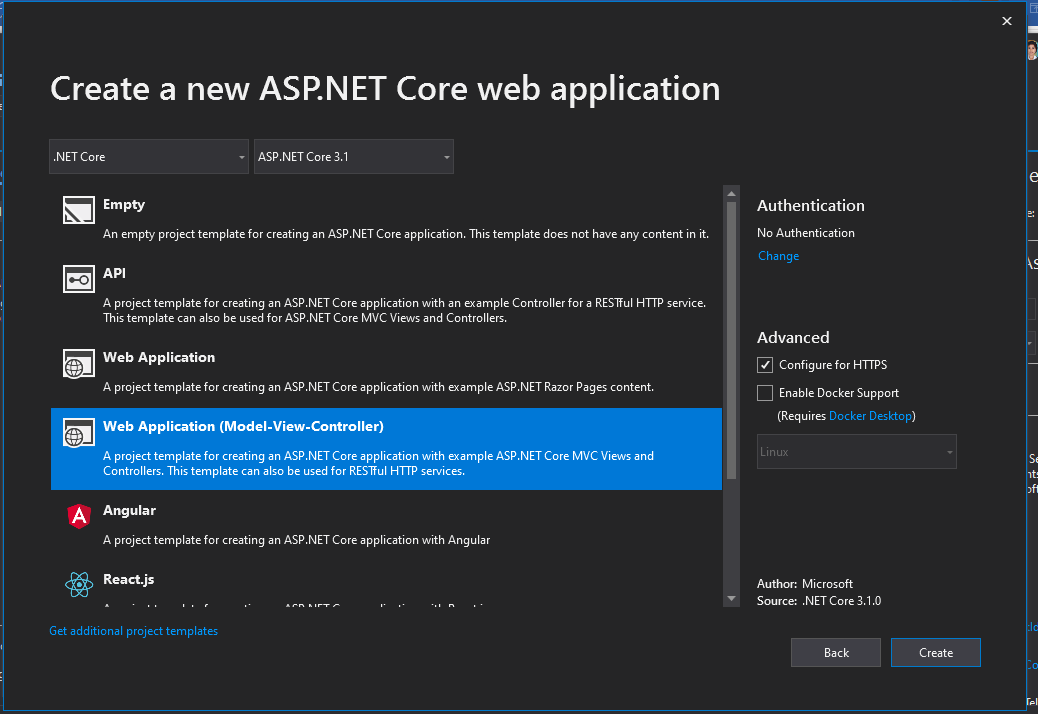
Now create a Web Application (Model-View-Controller) project in either Visual Studio or VS Code.
Packages to Be Installed
The NuGet Package Microsoft.ApplicationInsights.AspNetCore. After adding Application Insights to your project, check to make sure that you’re using the latest stable release of the SDK. Go to Project > Manage NuGet Packages > Microsoft.ApplicationInsights.AspNetCore. If you need to, choose Update.
The default installation of Application Insights collects several kind of telemetry data
| Pageviews | Speak for itself, tracks all page views. |
| Requests | All requests, pages, images, stylesheets, scripts, etc. |
| Exceptions | All requests that return exceptions are tracked. 400 and 500 status codes. |
| Dependencies | Queries to the database or calls to external web services. |
| Trace | Trace information is tracked. |
| Events | Events can be tracked via the API. A brief explanation of how you can do this is provided in the next section. |
| Performance counters | Performance counters provide telemetry data about your servers. |
| Availability | Availability tests can be created in the portal. This can be either URL ping tests or multi-step tests. |
Set up the Instrumentation Key
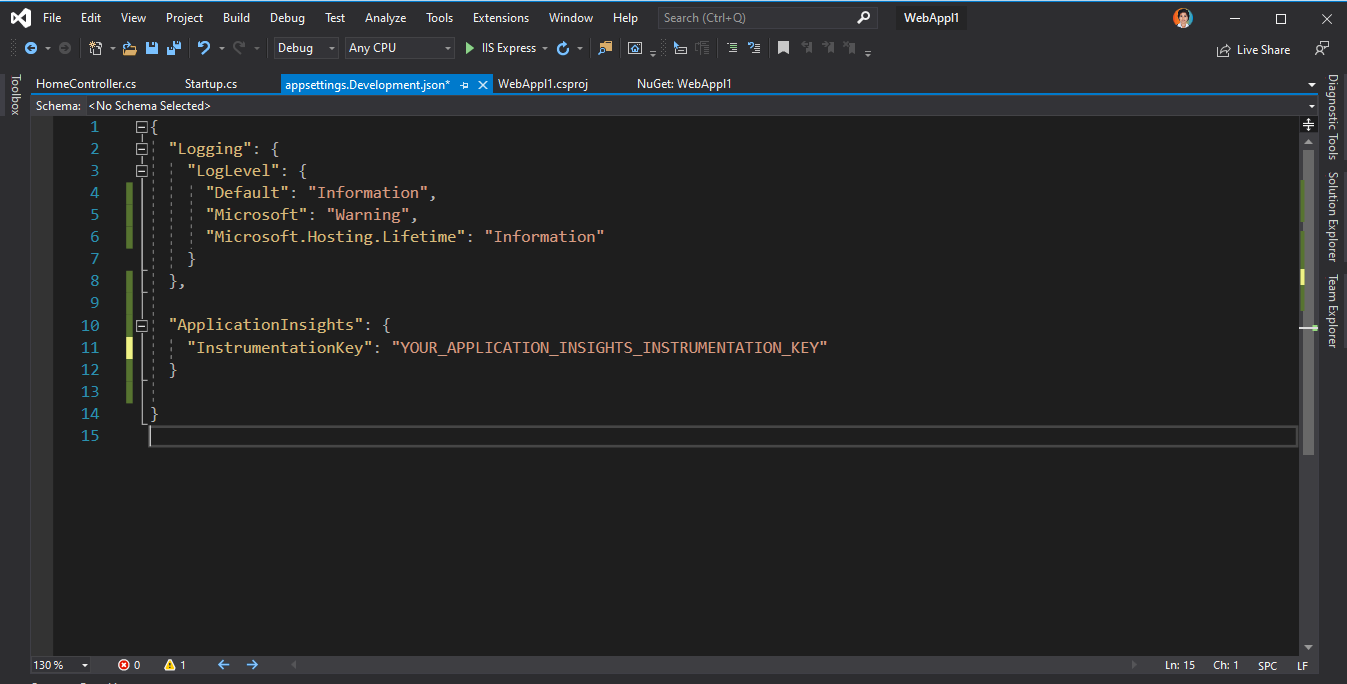
Add the below code snippet in the appSettings.Development.json file.
Although you can provide the instrumentation key as an argument to AddApplicationInsightsTelemetry, we recommend that you specify the instrumentation key in configuration. The following code sample shows how to specify an instrumentation key in appSettings.Development.json. Make sure appsettings.json is copied to the application root folder while publishing.
{
  "Logging": {
    "LogLevel": {
      "Default": "Information",
      "Microsoft": "Warning",
      "Microsoft.Hosting.Lifetime": "Information"
    }
  },

  "ApplicationInsights": {
    "InstrumentationKey": "your_application_insights_instrumentation_key"
  }

}
Alternatively, specify the instrumentation key in either of the following environment variables
- appinsights_instrumentationkey
- ApplicationInsights:InstrumentationKey
For example:
- SET ApplicationInsights:InstrumentationKey= your_application_insights_instrumentation_key
- SET appinsights_instrumentationkey= your_application_insights_instrumentation_key
- appinsights_instrumentationkey is typically used in Azure Web Apps, but can also be used in all places where this SDK is supported.
The file will look like
Application Insights captures and sends ILogger logs by using the same TelemetryConfiguration that is used for every other telemetry. But there is an exception. By default, TelemetryConfiguration is not fully set up when you log from Program.cs or Startup.cs. Logs from these places will not have the default configuration, so they will not be running all TelemetryInitializers and TelemetryProcessors.
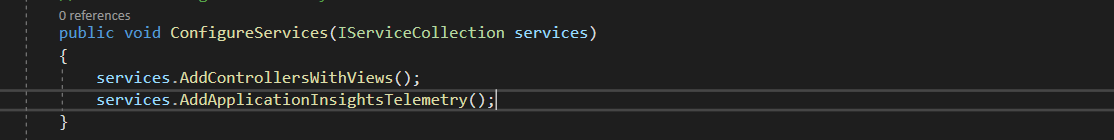
In the Startup.cs file, under the ConfigureServices method, add the line services.AddApplicationInsightsTelemetry().
In the HomeController.cs file add the following code
When a stand-alone package is used, TelemetryClient is not injected into the DI container, so you need to create a new instance of TelemetryClient and use the same configuration as the logger provider uses. This ensures that the same configuration is used for all custom telemetry.
Here I have created methods for GET, PUT, POST, and DELETE operations
namespace WebAppl1.Controllers
{
    [Route("api/[controller]")]
    [ApiController]
    public class HomeController : ControllerBase
    {
        readonly TelemetryClient telemetryClient;

        public HomeController(
            TelemetryClient telemetryClient)
        {
            telemetryClient = telemetryClient;
        }
       [HttpGet("{id}")]
        public ActionResult<string> Get(int id)
        {
            telemetryClient.TrackEvent(
                "Get",
                new Dictionary<string, string>() { { "id", id.ToString() } });

            return "value";
        }


        [HttpGet]
        public ActionResult<IEnumerable<string>> Get()
        {
            telemetryClient.TrackEvent(
                "Get");

            return new string[] { "value1", "value2" };
        }
        [HttpPut("{id}")]
        public ActionResult<string> Put(int id, [FromBody] string value)
        {
            telemetryClient.TrackEvent(
               "Put",
                new Dictionary<string, string>() { { "id", id.ToString() }, { "value", value } });

            return value;
        }

        [HttpPost]
        public ActionResult<string> Post([FromBody] string value)
        {
            telemetryClient.TrackEvent(
               "Post",
                new Dictionary<string, string>() { { "value", value } });

            return value;
        }


        [HttpDelete("{id}")]
        public void Delete(int id)
        {
            telemetryClient.TrackEvent(
                "Delete",
                new Dictionary<string, string>() { { "id", id.ToString() } });
        }
    }

}
Here TelemetryClient is being injected. In each method, we are trying to track the request type and any variable that is passed, in Application Insights.
Run your application and create requests to it, here in Postman, we can create requests for the GET, POST, PUT and DELETE against the API methods in our Web Application.
The Telemetry flows to Application Insights, where the SDK automatically collects incoming web requests to your application, along with the following telemetry as well.
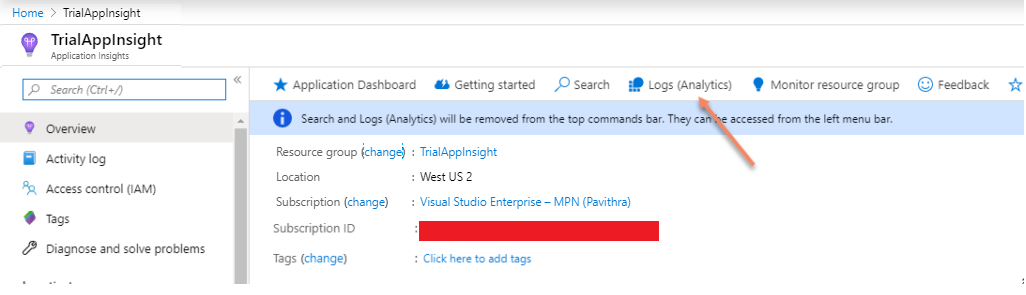
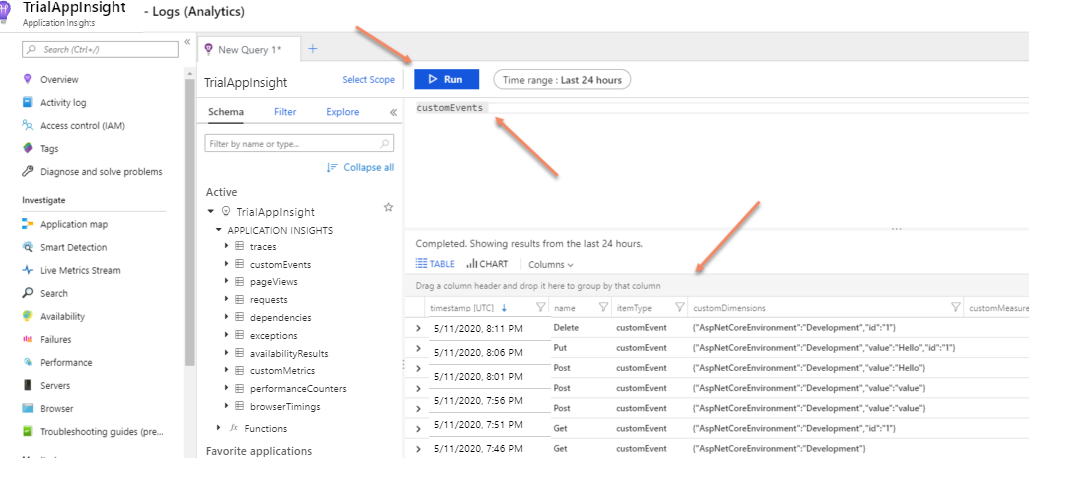
In the Azure Portal, navigate to the Application Insights resource, and click Log Analytics.
Log queries help you to fully leverage the value of the data collected in Azure Monitor Logs. Query your custom events by entering “customEvents” in the prompt and click Run.
Conclusion
Application Insights is a great measurement tool that provides complete insight into the usage of your application. This will help you solve exceptions, performance problems and it can even be helpful to improve the user experience of your application.
Also, check out our Application Insights logging blog to learn how to monitor the performance of the business application. Happy learning!