
Microsoft Azure offers a cloud-based messaging service called Azure Service Bus. The goal is to streamline communication between disparate components or applications, regardless of whether they are distributed across multiple environments and locations or operating on the same Azure platform.
With Azure Service Bus, you can develop distributed systems that are scalable, reliable, and decoupled.
What is Azure Service Bus Monitoring?
Azure Service Bus monitoring is the process of evaluating and monitoring the health, resource usage, and performance of Azure Service Bus.
5 Benefits of using Azure Service Bus Monitoring
Service Bus monitoring can be performed on the following aspects to achieve greater effectiveness:
1. Metrics and properties
The performance of Service Bus resources is influenced by a range of metrics and properties that are supported by these resources. Message count, message delivery count, and many other metrics are among them.
2. Resource status
The transmission and reception of metric data are directly impacted by Service Bus status. Monitoring the state of a Service Bus is crucial since, when in a state like Send Disabled (or Receive Disabled), messages cannot be sent or received.
3. Optimizing performance
Monitoring the Service Bus’s utilization enables you to adjust its parameters, such as the number of partitions and message prefetch count, and to maximize resource performance according to the supplied data load.
4. Message transmission status
Service Bus metrics, like completed and abandoned messages, enable you to monitor the number of failed message deliveries and take immediate measures to fix the problem.
5. Alerts
Alert systems that instantly notify you of any bottleneck or when the metric data surpasses error thresholds can be set up.
5 Best practices for effective Azure Service Bus Monitoring
The performance and data security of your Azure Service Bus depends on how well it is monitored. Here are some tips to make your Service Bus monitoring experience even better:
1. Choosing the right metrics
Azure Service Bus resources emit many metrics. A crucial part of monitoring is determining which metrics are appropriate for different business scenarios that affect the health and performance of the resources.
To gain insights into the health and performance of your Service Bus resources, configure the appropriate Azure metrics.
2. Setting up a proficient alert system
Establishing alert metrics and threshold values, as well as integrating communication services to deliver immediate notifications, will result in a more dependable and effective alert system.
3. Review and examine monitoring data regularly
The threshold values should be updated based on the usage patterns of your application, and a periodic analysis and action plan for any failure should be reviewed frequently.
4. Dynamic configuration tweaking for monitoring
For a dynamic monitoring system, the frequency of the monitoring rules and the aggregation period should be changed based on the application workload. A little tweak over the monitoring configuration can save a lot of time and effort required in issue detection and prolong business continuity.
5. Implement proactive measures to prevent issues
Every failure necessitates corrective action to enable active resource performance. Monitoring assists in identifying any issues with application performance and health, while corrective action contributes to complete failure healing. To avoid further damage to the business data, any team member should take immediate action to resolve the issue.
5 Key Metrics to monitor in Azure Service Bus
Despite the Service Bus emitting plenty of metrics, there are a few key metrics that determine the health and performance of the Service Bus.
Let’s take a quick look at the key metrics that influence the Service Bus.
1. Message Count
The Message Count metric identifies the number of messages in a Service Bus. By determining this count, you can know whether the Service Bus capacity should be increased or decreased based on the data load.
Based on the message type, the Message Count metric can be classified as follows:
- Active Message Count
- DeadLetter Message Count
- Scheduled Message Count
- Message Count
- Transfer DeadLetter Message Count
- Transfer Message Count
2. Active Connections
The Active Connections metric informs how many queues or topics actively listen to a particular Service Bus namespace to send or receive messages.
3. Size
The Size metric represents the maximum capacity of a Service Bus Queue (or) a Topic to store the incoming messages.
Monitoring this metric enables you to increase the Service Bus storage capacity to handle the massive volume of data.
4. DeadLetter Message Count
The DeadLetter Message Count property indicates the number of dead-lettered messages currently available in a Service Bus Queue (or) a Topic.
Suppose many dead-letter messages accumulate over an extended period. In that case, the dead-letter Queue (or) Topic can reach its capacity, which prevents it from receiving new messages and results in data loss. Monitoring this property alerts you when the dead-letter destination is approaching its maximum capacity.
5. Throttled Requests
Throttling happens when a client or application sends requests faster than what is allotted or permitted to the Azure Service Bus. These restrictions may pertain to the maximum quantity of connections made, the maximum number of requests per second, or other resource-specific constraints.
3 Main challenges in monitoring Azure Service Bus with Azure Monitor
Azure Monitor is a powerful tool for monitoring and managing native Azure services. Despite providing a monitoring solution, it falls short of most competitors as it fails to provide a holistic monitoring solution that can meet all business needs.
The difficulties Azure Monitor encountered when monitoring Azure Service Bus are as follows:
1. Lack of consolidated monitoring
It is not feasible to get a consolidated alert report by simultaneously monitoring several metrics of multiple Service Bus resources.
2. Complexity in setting up an alert system
The number of metric conditions allowed per alert in Azure Monitor is limited to two. Due to consumption-based pricing offered by the Azure Monitor, this results in a substantial Azure expenditure.
Azure Monitor offers limited communication services for transmitting violation reports.
3. Absence of an option to automatically fix the issues found
While Azure Monitor makes it possible to monitor metrics, fixing the problems that are found is essential to maintaining business operations. Automatically fixing the issues that have been discovered is not possible with Azure Monitor.
Achieve holistic Service Bus visibility with Turbo360
Turbo360 is a leading cloud management and monitoring platform that offers four different modules tailored to the business needs of different customers. Business Applications is one among them that virtualizes business architectures in logical containers and provides a holistic management and monitoring solution enabled across various Azure subscriptions and Azure services. The focus is reducing the burden on support services and optimizing service costs.
Automated issue resolution and aggregated alert reporting are the two significant challenges in Azure Service Bus monitoring.
Turbo360’s Business Applications module addresses these issues by supporting consolidated alert reports and allowing its users to configure an automated task to be executed in case of a monitoring rule violation, reducing manual efforts and ensuring smoother business continuity.
In contrast to the native Azure monitor, Turbo360’s Business Application packs a set of impressive features that redefines the monitoring solution by broadening the scope.
Let’s examine the Turbo360 Azure Service Bus monitoring tool’s features in detail:
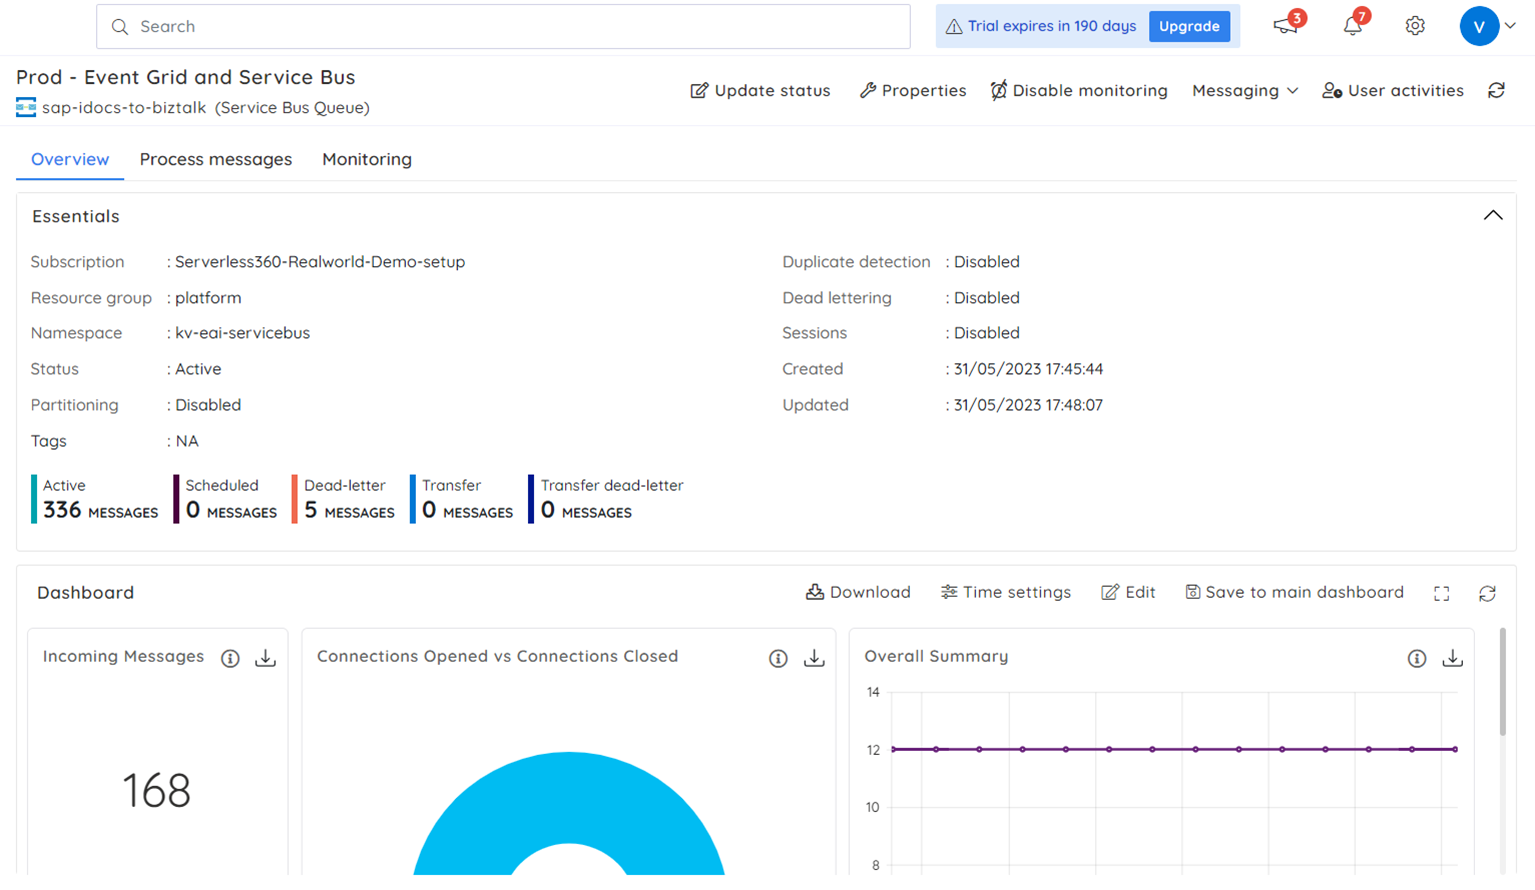
1. Powerful Dashboard
Turbo360 provides a powerful dashboard for each Azure Service Bus resource associated with a Business Application. These dashboards include a collection of pre-defined widgets that can be customized to visualize data and identify trends.
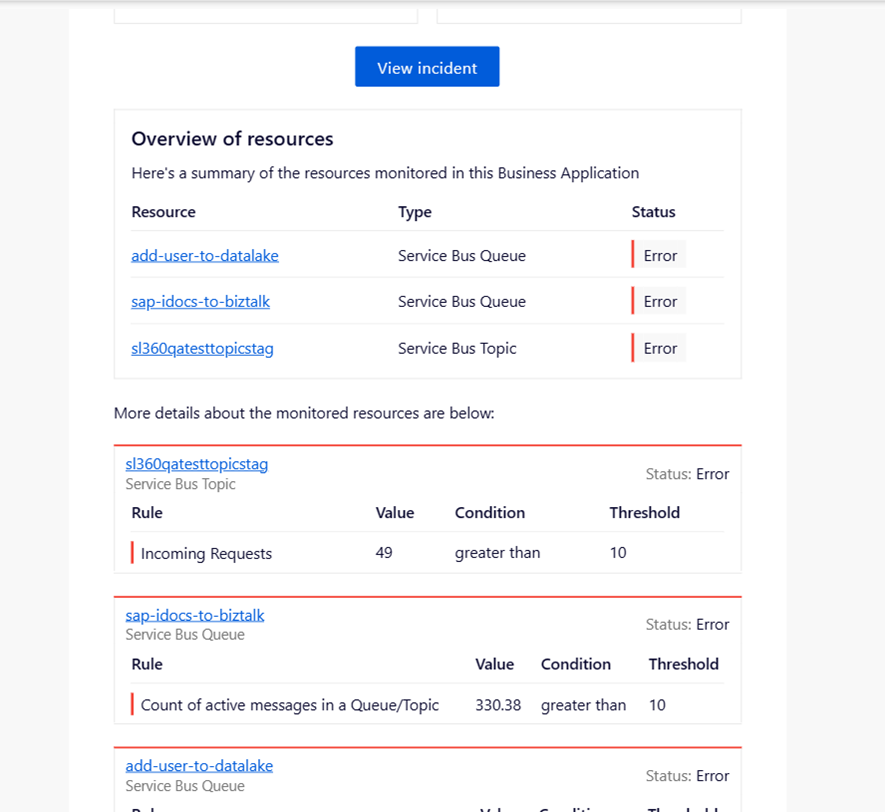
2. Consolidated alert reports
Turbo360 allows you to combine all your Azure Service Bus resources distributed across different Azure subscriptions into a single logical container and monitor them simultaneously for consolidated alert reporting at specified time intervals.
3. Comprehensive notification service support
Turbo360 integrates ten different notification services to send and receive notifications in your business communication channel.
Following is the list of supported notification services:
- ServiceNow
- SMTP
- PagerDuty
- Microsoft Teams
- Azure DevOps
- Opsgenie
- Operations Management Suite
- Webhook
- Twilio
- Slack
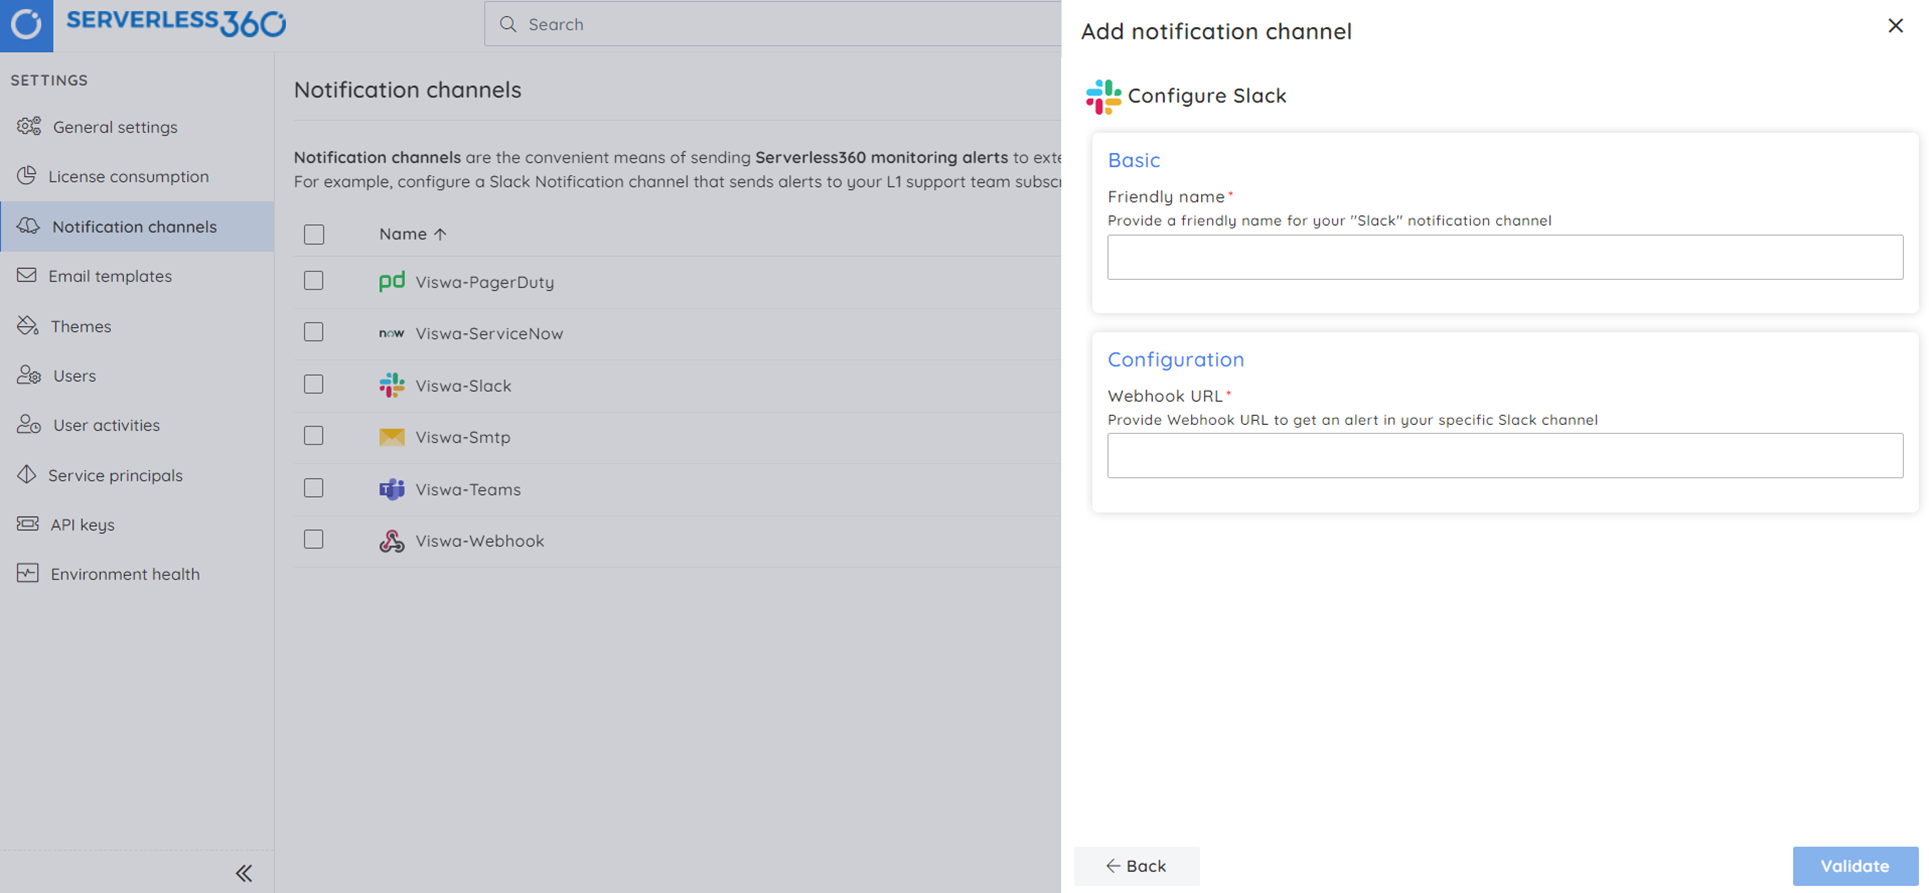
Assume that you handle all your business notifications through a Slack account. It’s simple to link your Turbo360 and Slack accounts to get all your notifications in one convenient location.
To proceed with the notification service integration, go to the following path and enter your Slack URL: Settings -> Notification channels -> Add notification channel -> Slack.
4. Automatic troubleshooting capability
Issues discovered during monitoring operations can be automatically resolved by configuring a task to be executed in case of a monitoring rule violation.
Assume the dead-letter queue has reached its maximum capacity. Incoming messages will not have enough space to reach the dead-letter queue, potentially resulting in data loss. This business scenario requires keeping track of the count of dead-lettered messages in a Queue (or) Topic and configuring a task for purging them when the error threshold is reached.
Follow these simple steps to resolve violations with Turbo360:
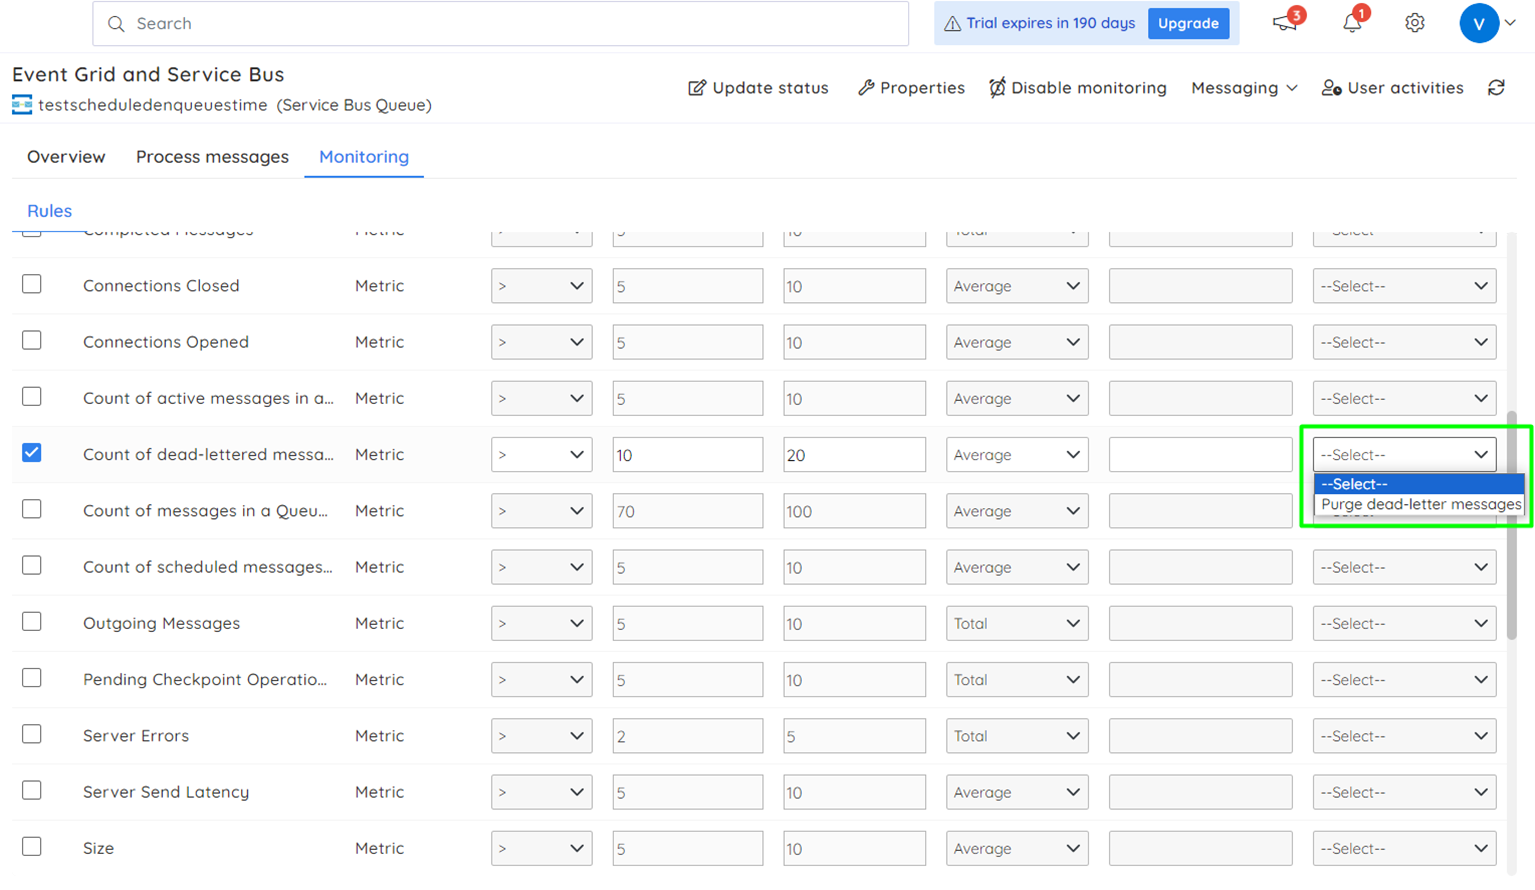
- Navigate to the following path: Service Bus Queue (or) Topic -> Monitoring.
- Select the Count of dead-lettered messages in a Queue/Topic metric and configure the threshold values.
- Choose one among the available task configurations from the Actions dropdown menu to execute in case of rule violation. Here, I’ve configured a task to purge all the dead-lettered messages available in a Storage queue to free up the storage space.
- Click the Save button to finish setting up the monitoring rules.
The configured task will be initiated once the metric value exceeds the threshold limit, and a violation alert is generated.
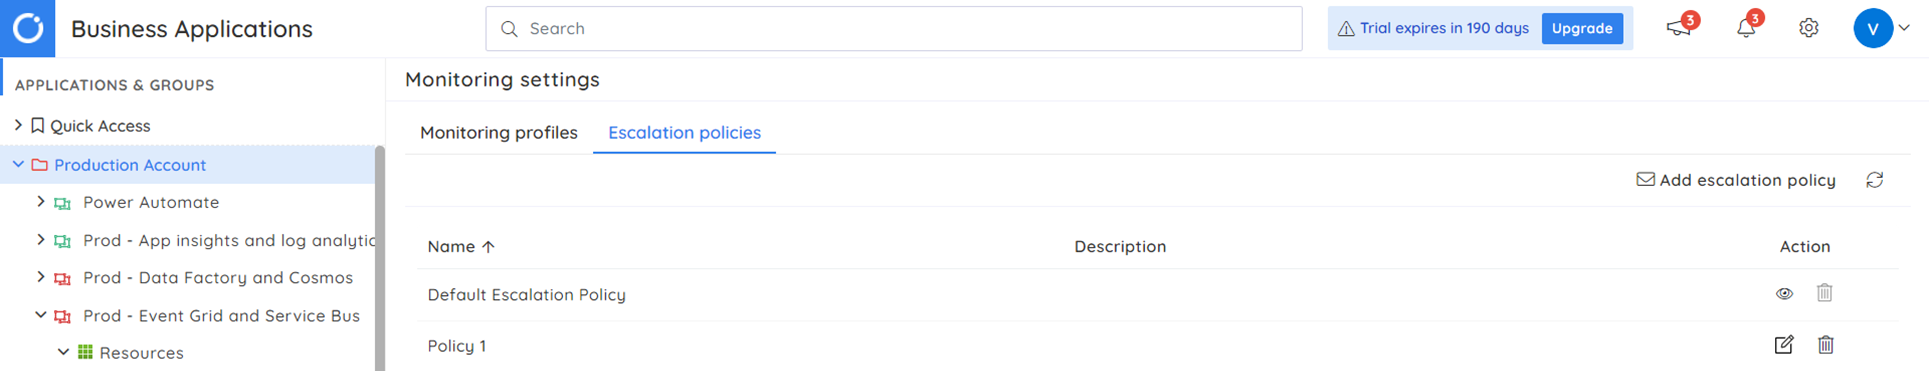
5. Escalation of high-priority alerts
You can define escalation policies and configure each escalation rule with various notification services to escalate violation alerts until appropriate action is taken.
An escalation policy can be created in the following path: Monitoring settings -> Escalation policies.
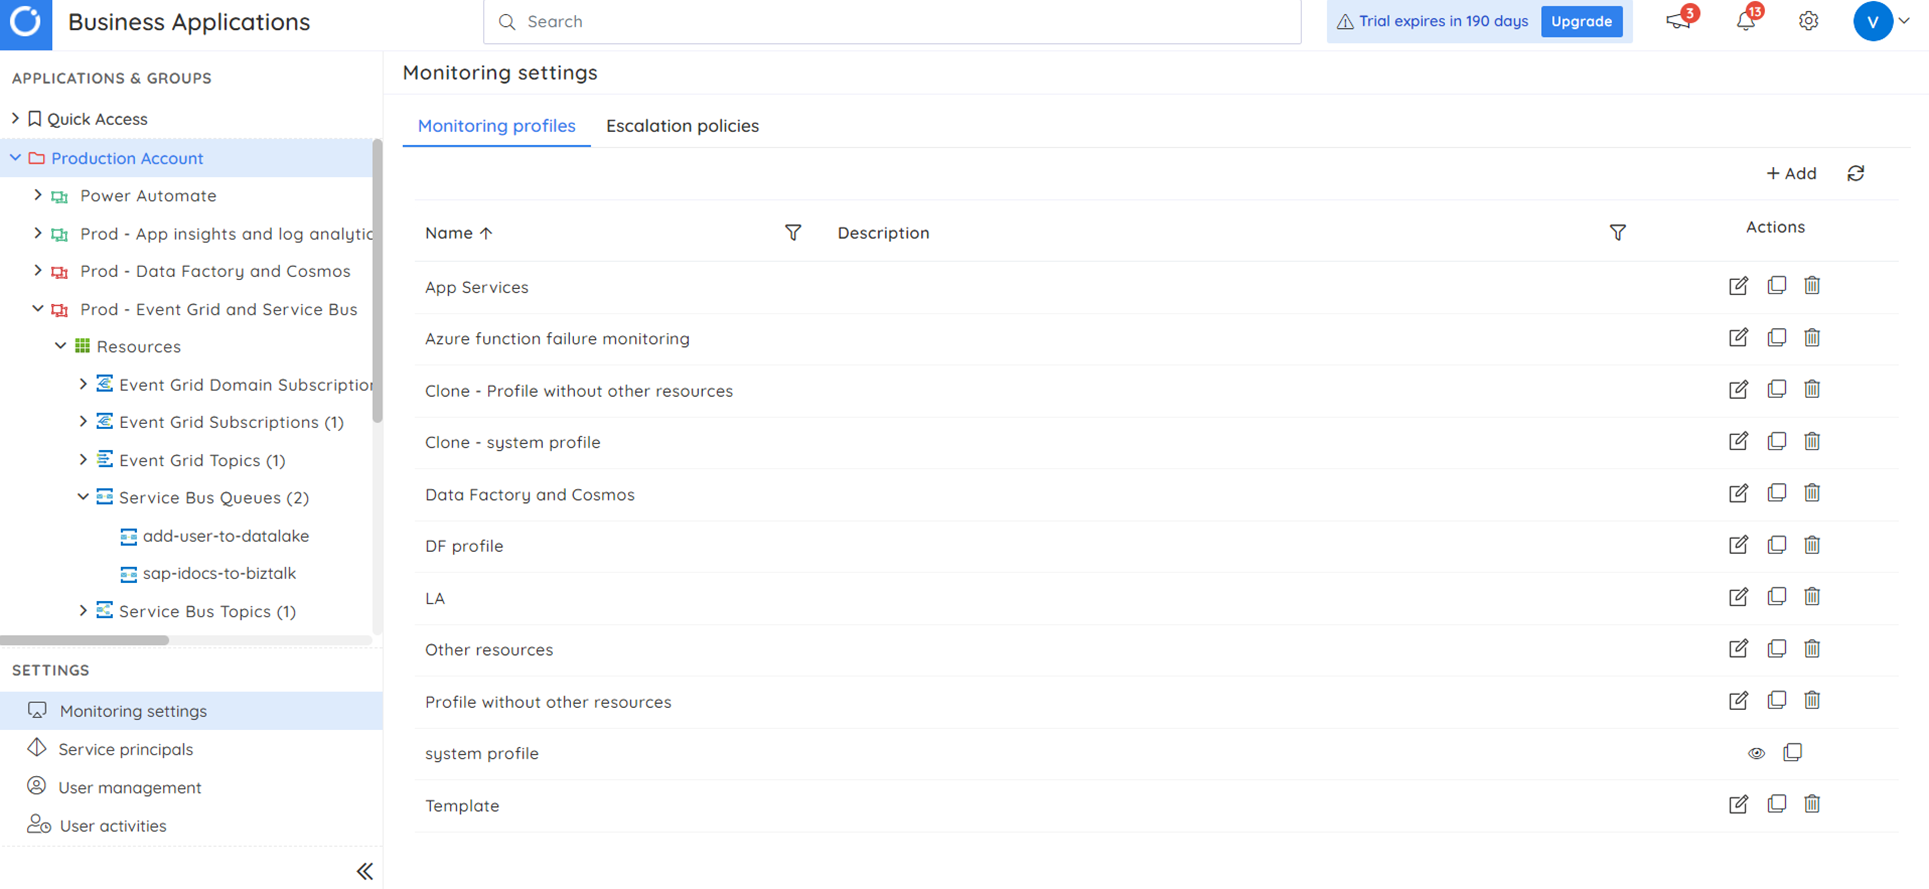
6. Monitoring different sets of metrics of a similar resource
A monitoring profile is a set of custom monitoring rules that you can apply to your Business Applications to monitor different sets of metrics on similar resources simultaneously.
A monitoring profile can be created in the following path: Monitoring settings -> Monitoring profiles.
Advantages of using Turbo360
Here’s a roundup of the advantages that you get when using Turbo360 to monitor your Azure Service Bus resources based on the above discussion:
- Consolidated alert reports
- Enhanced notification service support
- Automatic remediation of identified issues
- Escalation policies to escalate high-priority alerts for immediate response
- Monitoring multiple sets of metrics on similar resources at the same time.
Conclusion
Maintaining the security, dependability, and performance of your messaging infrastructure requires regular monitoring of Azure Service Bus. You can identify problems, enhance performance, and guarantee that your messaging system runs without hiccups by monitoring the Azure Service Bus.
With its automatic problem-solving, aggregated reporting, and total visibility over your serverless message architecture, Turbo360 offers a comprehensive suite of monitoring solutions.
Sign up for a 15-day free trial and experience an unprecedented monitoring solution that helps your business optimize performance and reduce costs.