In the software industry, monitoring and observability come hand in hand and are referenced simultaneously, but both are not the same thing. Having the right tools for these capabilities is vital to keep your systems, data, and security perimeter safe. With cloud solutions topping up in the integration space, great tools have been available in the market, and choosing the right one would be challenging. Turbo360 is considered one of the best tools for the monitoring and observability of Azure services and let‘s see why in this article.
What are monitoring and observability
Observability measures a system’s current state based on the data it generates. It is a technical solution that allows teams to debug their system actively and is based on exploring properties and patterns not defined in advance. An observability platform enables IT operations teams to monitor or gain a deeper understanding of the status and health of various apps and resources within your IT infrastructure. They can proactively identify anomalies, examine problems, and find solutions by drawing insights from each system’s data. The observability tools collect three data types – logs, metrics, and traces.
- Metrics – Measurements of how a service or component performs over time. For example, an observability tool might gather metrics about memory usage, bandwidth utilization, HTTP requests per second, or other systems.
- Logs – Records of events that occur on a specific system or application. The event information might be recorded as plain text, structured data, or binary format. Event logs are often the first thing administrators and developers look at when troubleshooting systems or application issues.
- Traces – Representational profiles of entire processes as they’re carried out across a distributed system. A trace links the events in a single request or transaction to provide a complete picture of how it flows from one point to the next. For example, traces can show how applications are contending for network and storage resources.
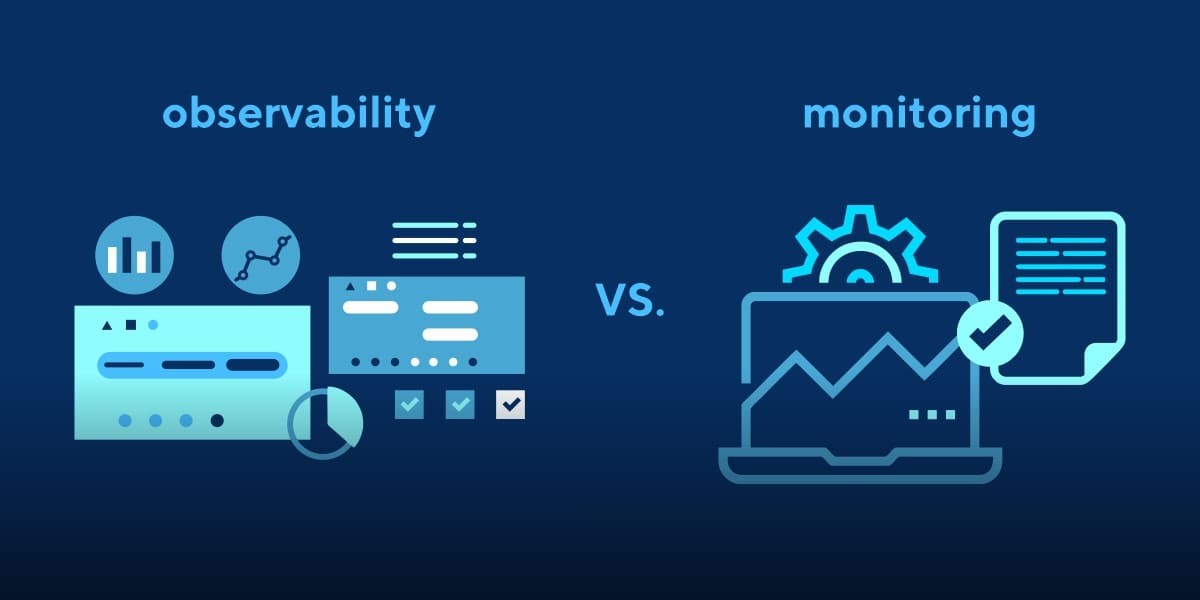
Monitoring uses preconfigured system data with dashboards and alerts to understand the application ‘s health and performance. It is observing, evaluating, and managing the health, performance, and availability of applications, architecture, and services. Most monitoring solutions use dashboards to display performance indicators and use, which IT professionals use to find or fix IT problems. However, because the team built such dashboards, they only show performance irregularities or concerns it may foresee. This concern makes it challenging for security and performance monitoring teams to keep an eye on complex cloud-native apps and environments, where security threats are frequently multi-faceted and unpredictable.
How to implement monitoring and observability?
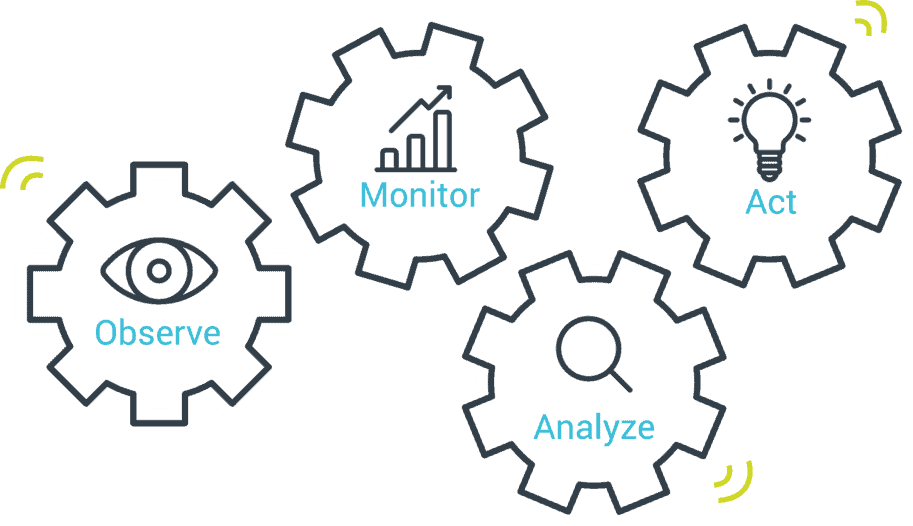
Monitoring and observability work best together since they each have a distinct function.
Monitoring alerts you to problems, whereas observability helps you figure out what’s wrong and why. Monitoring is a part of and a necessary observability action. Only observable systems can be monitored. Time-to-restore (TTR) is a crucial measure in the event of an outage or a deterioration in service. The capacity to quickly identify what went wrong and the quickest route to resuming service is a critical factor in TTR.
There are different strategies involved in implementing best practices for monitoring and observability. They must be designed in such a way that:
- Notify the users immediately during an outage
- Detect unauthorized access and bugs and help to debug them
- Identify long-term patterns for business models
- Explain any unintended consequences of modifications or new features.
It should be included as part of the development and can be made automated. Identifying and monitoring the key factors is more critical.
Common pitfalls of implementing monitoring and observability
There are some critical challenges in implementing monitoring and observability and identifying the right tools for them. The monitoring system must understand the components that must be measured. With the rise in the distributed microservices architecture in cloud-native solutions, these systems struggle to visualize and keep track of each of the services and the business processes.
From a monitoring perspective, the variety of workloads that might run inside a containerized environment is challenging because the monitoring tools must support an unpredictable set of technologies, architectures, and configurations. The alerting mechanism should have multiple pathways like emails, SMS, automated phone calls, dedicated mobile apps, etc. The mail list configuration should be so that it should reach only the intended people so that the critical alerts are not missed due to diffusion in responsibility. Also, the number of alerts should be minimized so they cannot be ignored. One of the main challenges is identifying and setting the proper threshold values and metrics, so the system is efficiently monitored.
How to measure monitoring and observability?
With the help of some internal metrics, we can check how well the system is being monitored.
The following details would help in measuring the monitoring capability:
- How fast is the situation tackled and brought to normal after an alert is received
- Based on the performance of the automated tasks and frequently checking for their configurations
- The number of false negatives and false positives and the out-of-hours alerts
- Unactionable items, usage of dashboards and graphs
- MTTD, MTTR impact
- Shift left capability to be more proactive to reduce the impact of the issue
Choosing the right tool for monitoring and observability
As organizations grow in their cloud-based applications, they must have more control and visibility into their environments. Many tools available in the market can be used to monitor, maintain and centralize their cloud-based services. The challenge lies in choosing the right tool. Out of the tools available, Serverlss360 ranks first with its variant monitoring and operational capabilities bundled in it. While the other tools mainly focus on system performance, Serverlss360 covers all the Azure resources available, representing them as Business Applications. With visualization and monitoring, Turbo360 offers the operational tool to fix the issue.
How to Improve Your Company’s Security Posture with Monitoring and Observability?
For any organization, security is considered an important aspect. Installing or using any third–party tool would require security compliance.

Security posture is a measurement of how secure and engaged the organization is, and the level of preparedness when an attack occurs or a vulnerability is identified. With malicious attacks constantly increasing, sensitive data is at risk. Security assessments must be performed periodically, and awareness has to be created among the teams. An incident management plan helps determine the steps to be taken after a violation and helps in reducing the remediation time. Once a process for risk assessment is developed, taking action to fix and manage time and efforts will become more efficient.
Your Full Stack, End-to-End Monitoring and Observability Partner
Here is your full-stack end-to-end monitoring and observability partner – Turbo360. Let’s see why and how.
Turbo360 is one platform to Manage and Monitor Azure resources related to Serverless services. In a real-time scenario, the integrated cloud applications are not built in a single technology stack, typically involving at least 3 or 4 different Azure Services. Azure Portal is designed more for vertical technology silos, and it’s challenging to visualize and manage such connected solutions. Turbo360 is one tool you can depend on to manage and monitor all your distributed Azure Services in one place.
It provides advanced observability for Azure services by
- Azure monitoring with consolidated error reports & live dashboards on KPIs
- Visualize entire Azure apps & their dependencies in an interactive map
- Enable self-healing to remediate operational failures & spend less time on troubleshooting
Turbo360 comes with the following modules, which help in effective monitoring and observability capabilities.
Do you want to monitor multiple Azure resources deployed across subscriptions? See how Kleinschmidt – a leading logistics company achieved single-pane-of-view using Turbo360. Watch Now!
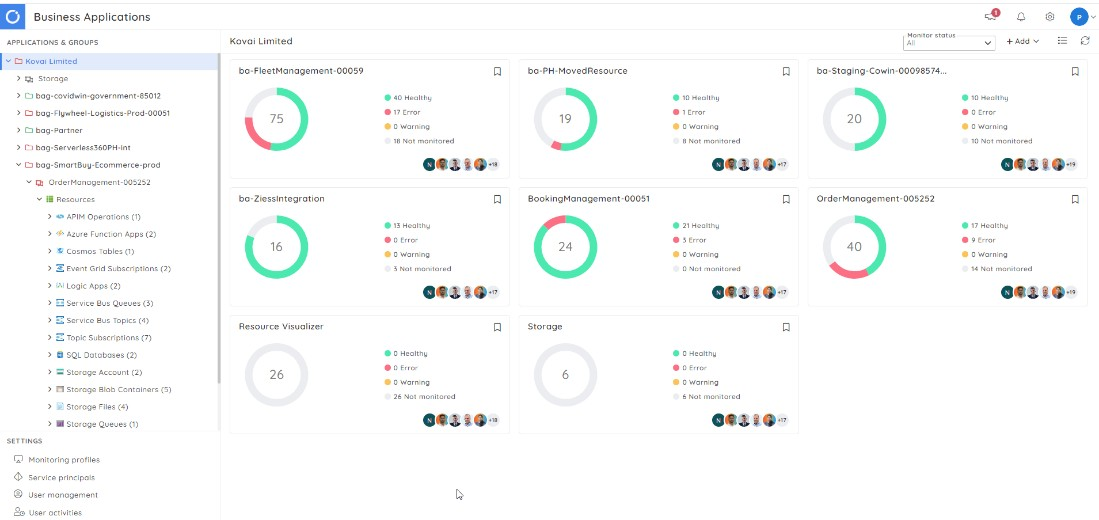
Business Applications – Business Applications are logical containers to collect Microsoft Azure services like Service Bus, Logic Apps, Event Hubs, Event Grid, Azure Function Apps, etc., that constitute a Line of Business applications in the application architecture. These resources can be from different Azure Subscriptions, Regions, and namespaces.
Business Activity Monitoring – Perform end-to-end message tracking and capture necessary business process flow data across Azure resources and hybrid integrations.
Azure Documenter – allows users to create technical documentation on their Azure subscriptions.
Cost Analyzer – gives clear visibility of the Azure cost for users, which will help optimize and reduce wastages.
Conclusion
With the comprehensive set of features in Turbo360, it becomes the right tool for monitoring and managing Azure resources. Why not try Turbo360 and efficiently monitor your Azure resources?