Introduction
One common problem that Azure users face is the struggle to manage their cloud estate. As the investment in the cloud grows this problem will increase and they quickly find that the estate becomes so complex they lose sight of what it looks like due to which it becomes harder to manage the costs at the Application Level.
So, it is very essential to have visibility on the entire application and track the total cost spent on the Azure resources.
Resource Management in the Azure portal
If you are using Azure services to build your applications, the Azure portal provides the capabilities to manage them at the resource level. For Example: If your application includes Azure Functions, Logic Apps, Azure SQL DB, Web Apps, etc, you get to manage them at the resource level in the Azure portal.
But what additionally required is application-level management. Though these Azure resources can be grouped in a resource group, it doesn’t provide visibility on the application.
It is not possible to track Azure costs at the Application level in the Azure portal.
How Turbo360 can help?
- There is a feature called Resource Map in Turbo360 through which it is possible to view all the resources under one roof and have a clear view of the cost spent on Azure resources.
- The main objective of Resource Map is, to provide a logical view for the cloud resources and help in managing those resources actively whenever it changes. Resource Map is a platform to govern Azure resources from different subscriptions in one place.
- Resource Map has the capability to accommodate all Azure resources to provide their cost visualization.
- In Azure portal, it is not possible to manage the resources based on environments like development, production, and staging which are nothing but different stages of an application whereas Resource Map in Turbo360 supports categorizing the Azure resources into different environments
Resource Map in Turbo360
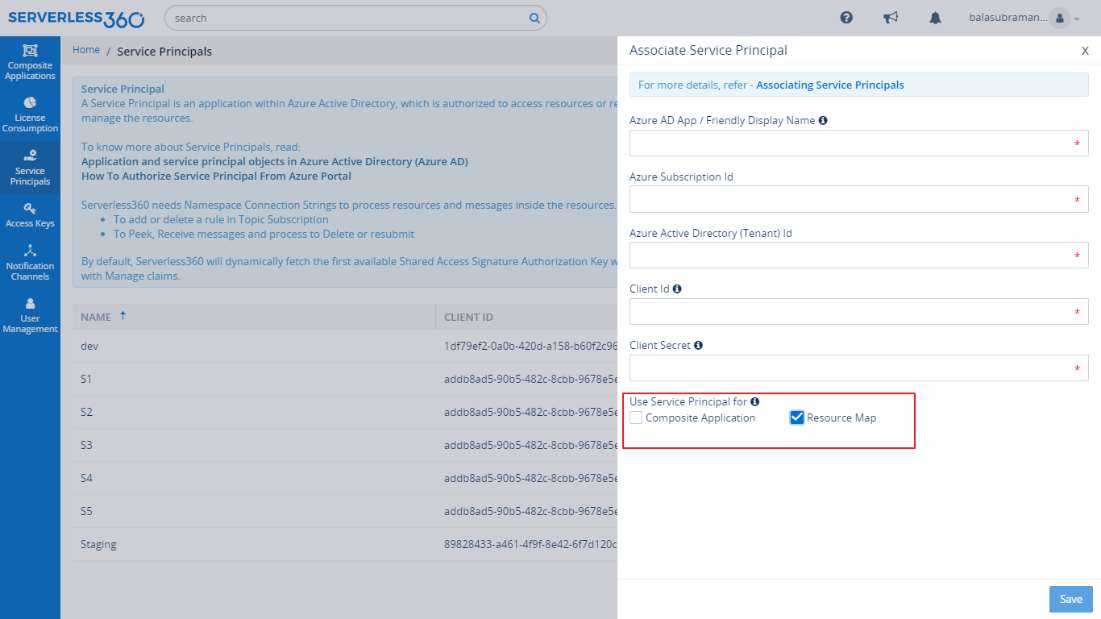
Azure resources from different resource groups can be grouped under a single scope. These Azure resources are accessed via service principal associated with the Turbo360 account.
It is important to know about associating Azure resources to Resource Map and about some of its features before getting into cost analysis.
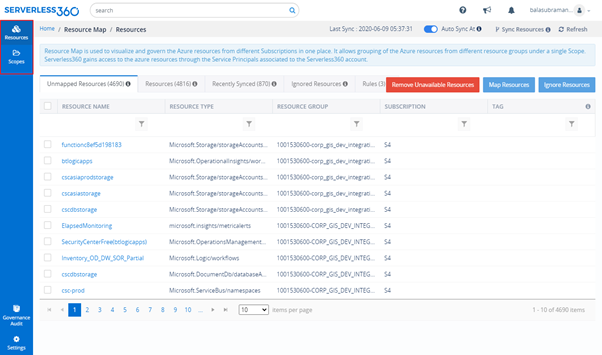
Resources
The first screen under Resource Map is the Resources section where Azure resources from different subscriptions will be synced to the Resource Map of Turbo360. These resources are brought into Turbo360 with the help of the service principal.
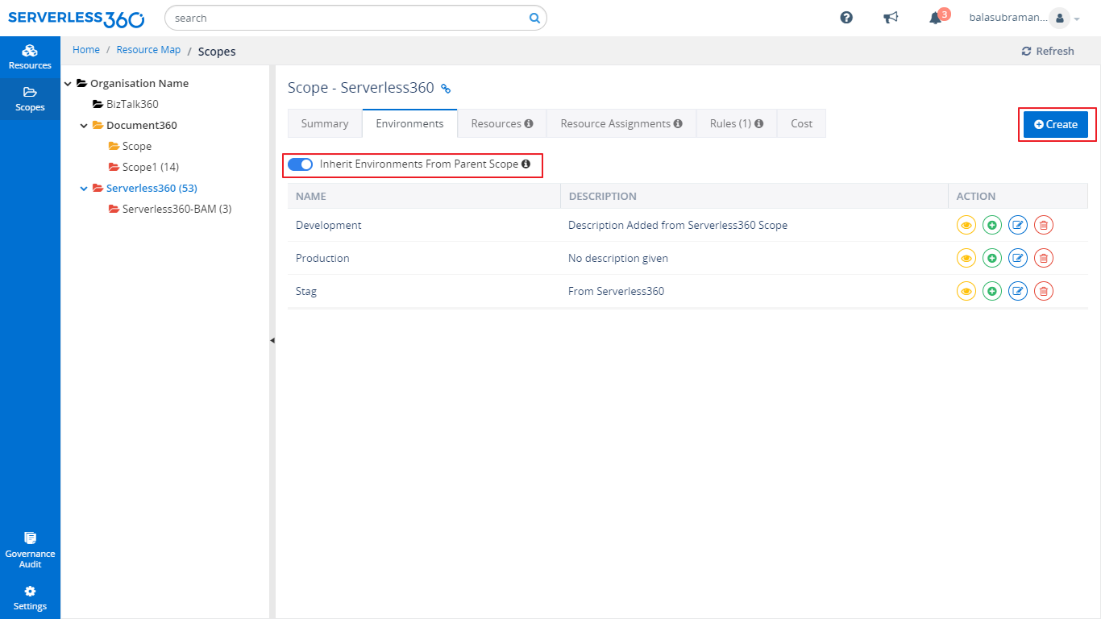
Scopes
Scope states where your resources belong to. Scopes are represented in a tree-like structure in Turbo360. Scopes are logical grouping which in turn can have multiple environments and resources underlying. All these can be grouped to represent an organizational hierarchy.
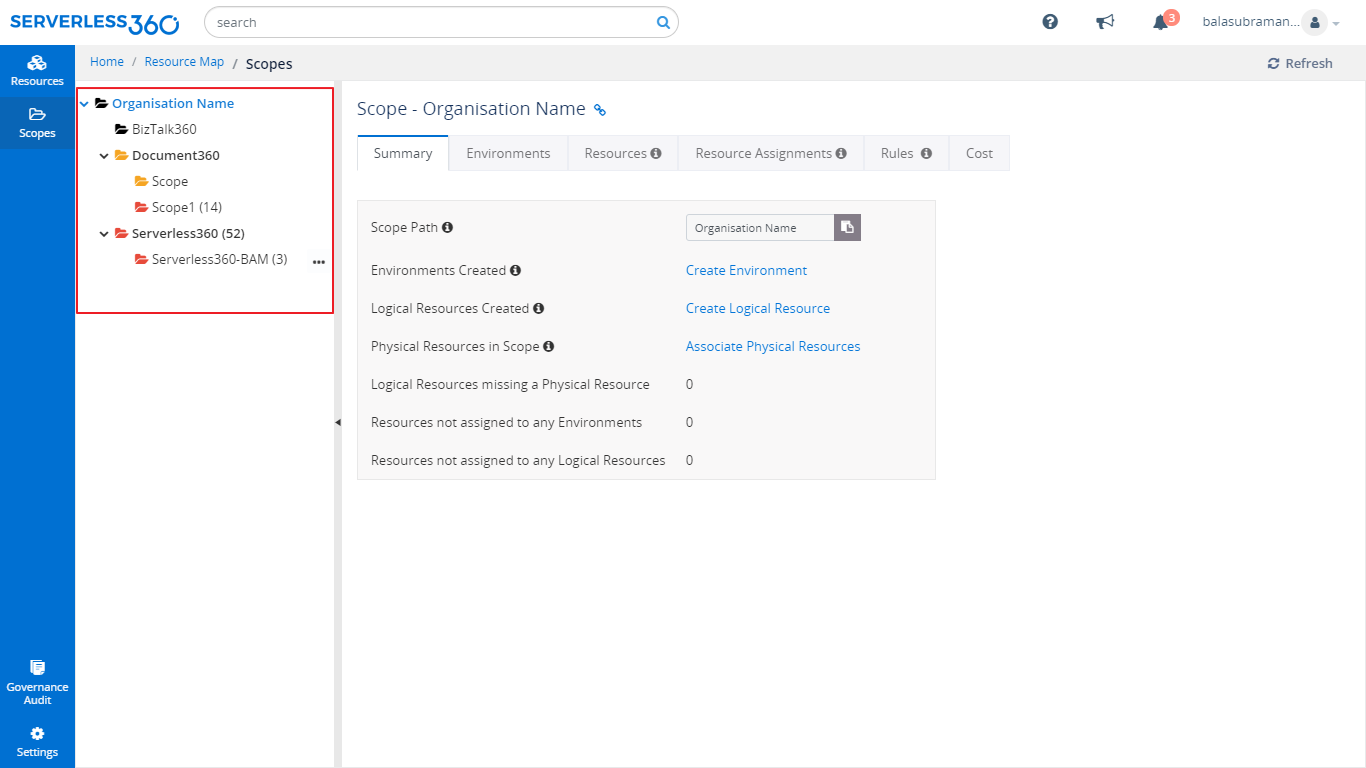
The scope icon has different colors
- Red – Represents there are unassigned physical resources in the scope, the number of unassigned resources also shown with that.
- Orange – Represents there are unassigned logical resources in the scope
- Green – Represents the resource assignment is complete i.e. all the logical resources have physical resources in all its environment.
Environment
For each resource, you will allocate it to an environment. In the tree structure of scopes, you can set which environments your company uses. It may be Dev/Test/Prod or more complex. You can then inherit this structure down the tree and in some cases, you might decide that some areas have different environments such as Dev/Test/UAT/Production. You can model this as required. The result is each resource is also allocated to an environment.
Logical Resource
When you have a dev/test/production scenario you will often find that you have multiple resources that are really the same thing. They are just the dev/test/production versions of each other. In Resource Map we provide a way that you can indicate that the physical resources are really just different instances of the same logical resource.
Rules
Rules will allow to auto allocate resources to scopes, logical resources, and environments. It minimizes the overhead required to maintain your Resource Map.
Cost Analysis
Understanding the cost spent on Azure Services is critical, especially while opting for Serverless architecture. Cost visualization capability in Resource Map provides the required clarity on the spending in your Azure subscription, in fact, across subscriptions.
The below picture represents the cost of the Application for the Scope – “Fit App”. We could acquire the Azure cost analysis of the resources, types, and environments.
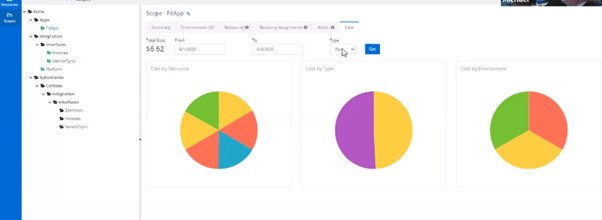
It is possible to fulfill the following use cases using Resource Maps
- The cost spent for a specific period by setting a filter on the from and to period.
- Graphical representation of cost spent for a specific period on a resource, resource type, and environment by choosing pie or bar chart.
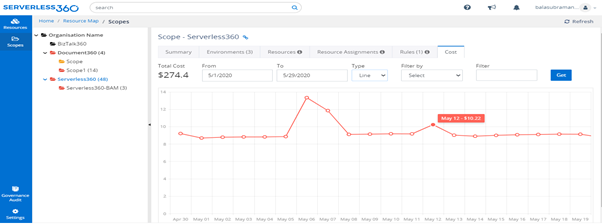
- Day wise Cost spent on a specific resource or resource type or environment can be attained by choosing the line chart.
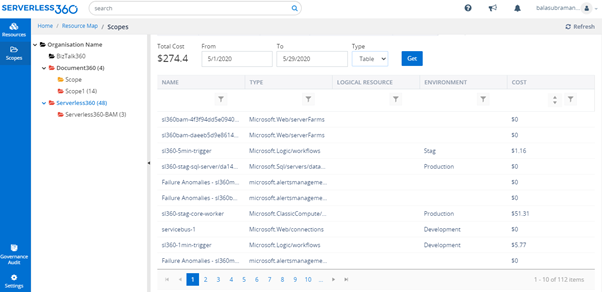
The table chart can visualize cost as data for the specified duration.
This is how the Resource Map feature in Turbo360 provides deep cost analysis for your application.
Conclusion
I hope this article helps you to understand the difference between Cost Analysis in the Azure portal and Turbo360. As discussed above, the Resource Map feature in Turbo360.
Azure cost analysis tool helps you to keep track of Azure Costs at the Application Level by providing complete visibility on the application.