Recently we launched features to provide support for Log Analytics in Turbo360. Log Analytics workspaces are used by a lot of different features within the Azure Monitor stack and by providing the ability to link a Log Analytics Workspace to a Business Application in Turbo360 we see that it provides a way you can allow a support user the ability to view and run queries against your log data without needing to be an Azure Expert.
We see that there could be several use cases opened up by this feature, in addition to allowing support operators the ability to see what’s happening in your solution we think it will help you to create friendly dashboards which can let managers see highlights of how the application is performing too.
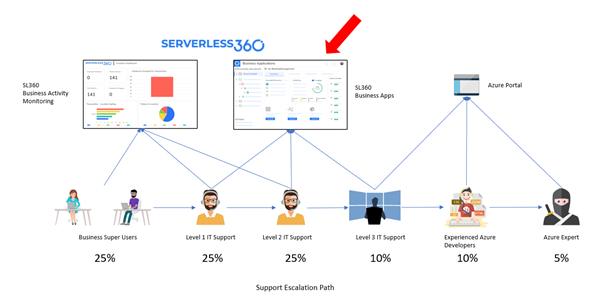
If we link back to the core principles of Turbo360. We want to democratize the support experience for your application. We want to make it easier for your team to support an application built with Azure without the need for Azure expert level skills to perform the day-to-day support and operations tasks that your support team.
If we consider the typical support escalation path, we see that so many of the support tasks require a senior level of Azure experience then the breakdown of work looks like below.
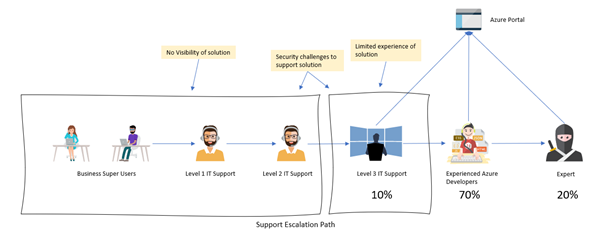
If we link the Log Analytics workspace to the business application, then we add to the capability that your level 1 and 2 support users can do to help resolve support issues.
By adding support for queries against Log Analytics then we can visualize data from any resources you configure in Azure to send data to log analytics. This can include things like:
- Logic Apps Consumption
- App Service Plan
- Web App
- Functions
- Virtual Machines
- Web Application Firewall
- Frontdoor
- Databases
- Synapse
To spot if a resource can send metrics to a Log Analytics Workspace then you are usually looking for a menu item called Diagnostics Settings.
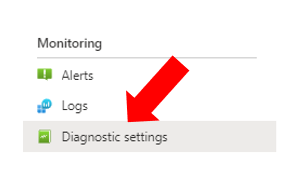
In the resource, you will be able to choose which of the available logs will be sent to the Log Analytics Workspace and then from there, you will be able to query them.
Our aim with the Turbo360 Log Analytics features is to allow you to present queries to a support user within the context of managing and operating your application.
In Turbo360 your Business Application allows you to group resources that work together to solve a business problem regardless of where in Azure they are deployed. You can then add queries of Log Analytics which can be used by the support used to help support that Business Application.
If we take a simple example where I have an existing Logic App Consumption solution that queries for invoices then loads them into my database. I might have a solution that looks like the below example.
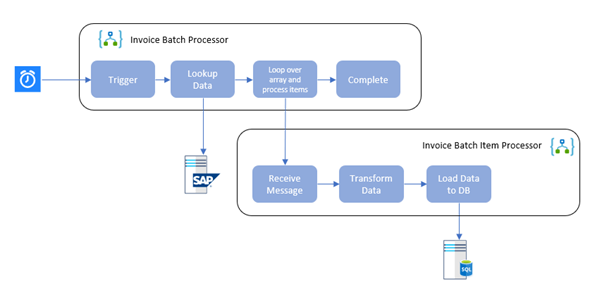
In this solution, you can just turn on the log analytics continuous export of data from a Logic App to the log analytics workspace and then you can do some queries of the log data to see what is happening in your Logic Apps.
I can also add tracked properties to shapes within my Logic App which will send context data to Log Analytics with the logic app actions and I will be able to query some of this data too.
As the Azure expert, you can then create some queries or get queries from our query library and save them in your Turbo360 Business application so that your support user can check and see what’s happening and answer some of the common support questions.
Execute Queries
The main feature for the support user is the ability to execute queries. I can create a query and save them to the query library to run later. Some of the common queries I may run would be ones like.
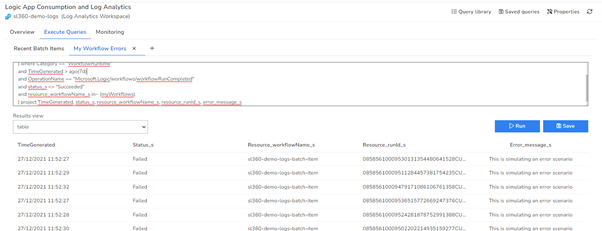
Show me the Recent Errors
I can add a query to show a list of the recent errors across all of my workflows of interest and display a table for the support operator to easily see which ones may have had a problem.
Query:
|
let myWorkflows = dynamic([“sl360-demo-logs-batch-item”, “sl360-demo-logs-batch”]); AzureDiagnostics | where Category == “WorkflowRuntime” and TimeGenerated > ago(7d) and OperationName == “Microsoft.Logic/workflows/workflowRunCompleted” and status_s <> “Succeeded” and resource_workflowName_s in~ (myWorkflows) | project TimeGenerated, status_s, resource_workflowName_s, resource_runId_s, error_message_s |
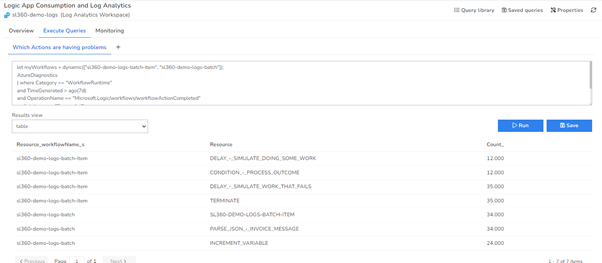
View the common actions that Fail in my logic apps
If I am having some problems with the processing in my Logic Apps then I can add queries to be able to see what actions have had errors and how many times that workflow/action combination has had an error within the period.
This can be invaluable in helping track down common problems.
Query:
|
let myWorkflows = dynamic([“sl360-demo-logs-batch-item”, “sl360-demo-logs-batch”]); AzureDiagnostics | where Category == “WorkflowRuntime” and TimeGenerated > ago(7d) and OperationName == “Microsoft.Logic/workflows/workflowActionCompleted” and status_s <> “Succeeded” and resource_workflowName_s in~ (myWorkflows) | summarize count() by resource_workflowName_s, Resource |
View a list based on Tracked Properties
If I have used tracked properties in my Logic App then I can use them within my queries. In the below picture you can see an example where I have saved a query so that the support operator can easily get a list of the batch items processed and their key properties.
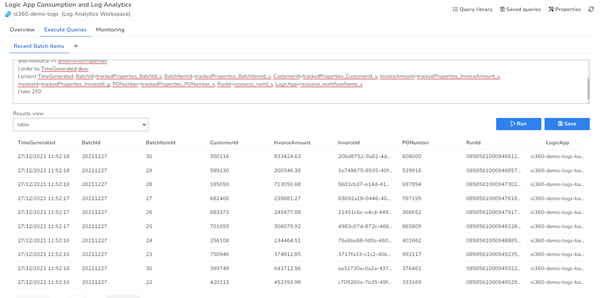
Query:
|
let actionWithProperties = “PARSE_JSON”; let myWorkflow = “sl360-demo-logs-batch-item”; AzureDiagnostics | where resource_workflowName_s == myWorkflow and OperationName == “Microsoft.Logic/workflows/workflowActionCompleted” and Resource == actionWithProperties | order by TimeGenerated desc | project TimeGenerated, BatchId=trackedProperties_BatchId_s, BatchItemId=trackedProperties_BatchItemId_s, CustomerId=trackedProperties_CustomerId_s, InvoiceAmount=trackedProperties_InvoiceAmount_s, InvoiceId=trackedProperties_InvoiceId_g, PONumber=trackedProperties_PONumber_s, RunId=resource_runId_s, LogicApp=resource_workflowName_s | take 250 |
Top Value Invoices Processed
If I want to do a query of the top 10 invoices processed by Value then I can display it in a table for the support operator like below. This might give them a view of some of the key invoices they want to do spot checks on the processing of.
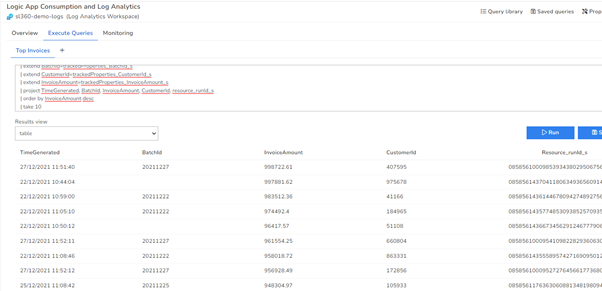
Query:
|
let actionWithProperties = “PARSE_JSON”; let myWorkflow = “sl360-demo-logs-batch-item”; AzureDiagnostics | where TimeGenerated > ago(7d) and resource_workflowName_s == myWorkflow and OperationName == “Microsoft.Logic/workflows/workflowActionCompleted” and Resource == actionWithProperties | order by TimeGenerated desc | extend BatchId=trackedProperties_BatchId_s | extend CustomerId=trackedProperties_CustomerId_s | extend InvoiceAmount=trackedProperties_InvoiceAmount_s | project TimeGenerated, BatchId, InvoiceAmount, CustomerId, resource_runId_s | order by InvoiceAmount desc | take 10 |
Dashboard
Turbo360 Dashboards are a very popular feature with users. A dashboard aims to give you a highlighted view of how your app is performing. In the case where I am using Logic Apps Consumption which is continuously exporting data to Log Analytics then I can use some common queries to create a dashboard that will combine information from the metrics API with information from Log Analytics.
The below picture is an example of a dashboard that shows:
- Recently Processed Batches
- A summary of errors per day
- A summary of the invoice amount processed per day
- Invoices processed per hour
- A summary of the actions which cause problems in processing
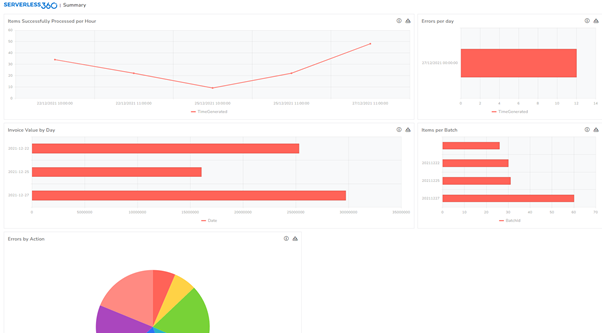
All of this data in the dashboard comes from the Log Analytics queries but you can add other metrics from other resources including your Logic Apps to produce a combined dashboard to give you a single pane of glass on how your application is performing.
FAQ
Hopefully, this article gives you some ideas on how you can leverage this feature to help support your Azure solutions and some questions you may be pondering at this point are discussed below.
Other Resources
In this article, I showed an example with Logic Apps Consumption of how we can use the Log Analytics features to help our support user. You can use this approach with lots of other types of resources in Azure and I will be talking more about some of these in upcoming articles.
Logic App Diagnostics
In this example, I showed how we can use the Logic Apps out of the box integration with Log Analytics to leverage the telemetry data to help me see what’s happening in my solution. The Log Analytics feature is a great way to quickly start visualizing what’s happening in your existing consumption Logic Apps and it will give you the ability to do quite a few useful things. The Turbo360 Business Application features will allow you to share this data with your support user in an easy-to-use way.
At Turbo360 we do have another feature in the product called Business Activity Monitoring. This will allow you to take your solution to the next level and provide user-friendly views of key milestones within your business transactions. We will be talking about this more in future posts.
More Information
You can also find out more about the differences between Log Analytics, App Insights and BAM on the Integrate 2021 session from Mike Stephenson and there are some more links below that you might find useful: