What is Azure Data Factory Pipeline?
Azure Data Factory is a cloud-based data integration tool focusing on data extraction, transformation, and loading. A pipeline in Azure Data Factory is a collection of processes that move data to a shared repository, such as a data warehouse.
Why it is important to monitor Azure Data Factory pipeline failures?
An Azure Data Factory pipeline is an orchestration that automates numerous tasks related to data extraction, transformation, and loading; therefore, if any of the events fail, the entire pipeline will fail.
Organizations depending on Data Factory pipelines will have a hassle-free experience if they keep track of the failed pipeline runs in the Data Factory and rectify it.
How to monitor failed pipeline runs in Data Factory?
Azure Data Factory pipeline run history can be accessed in the Studio of the respective Factory. The runs, inputs, outputs, and failure details will be available for each run.
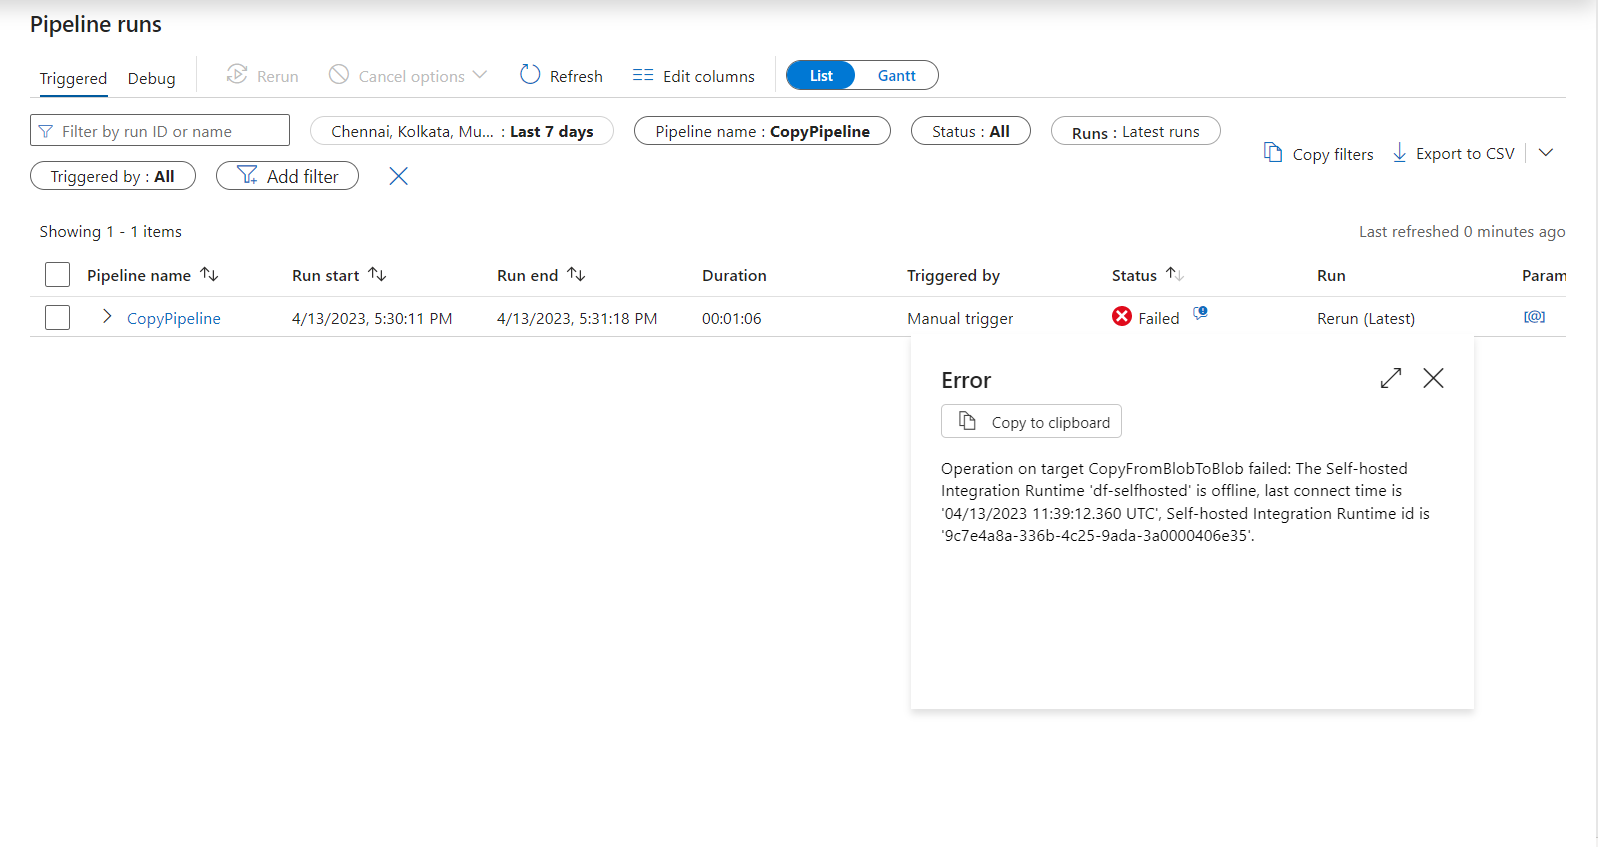
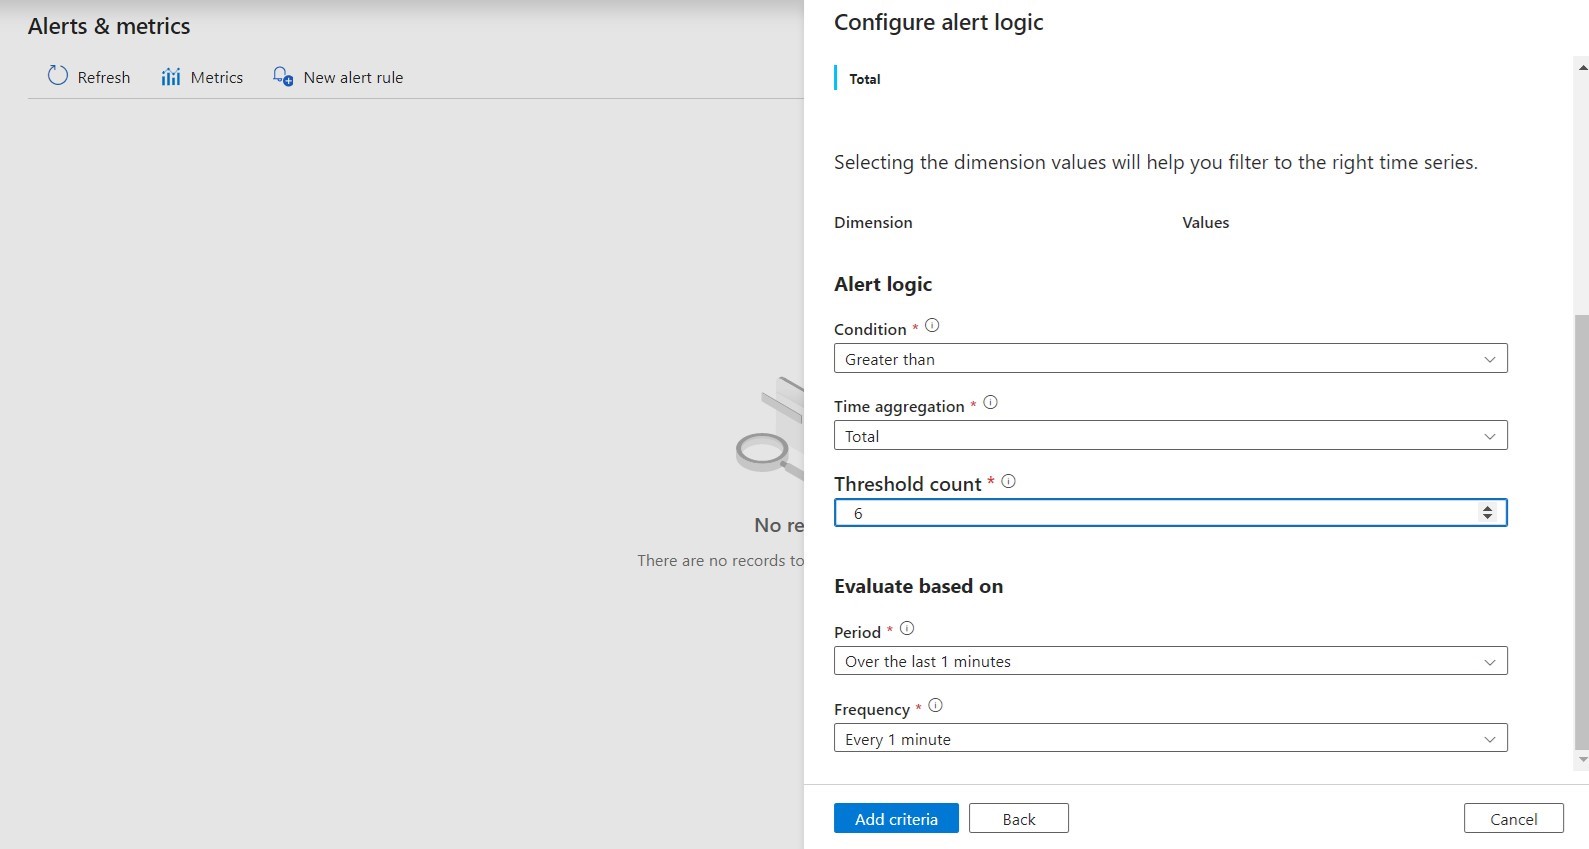
Failed runs in a Data Factory Pipeline can be monitored by navigating to Monitor -> Alerts & metrics. You will need to identify the monitoring criteria to define the alert logic and evaluation period.
You can set up notification channels to get alerts and stay informed on violations. Azure Action groups enable you to group several notification channels and instantly notify failure alerts to multiple channels.
Note: The defined criteria will only apply to the pipelines in a single Data Factory.
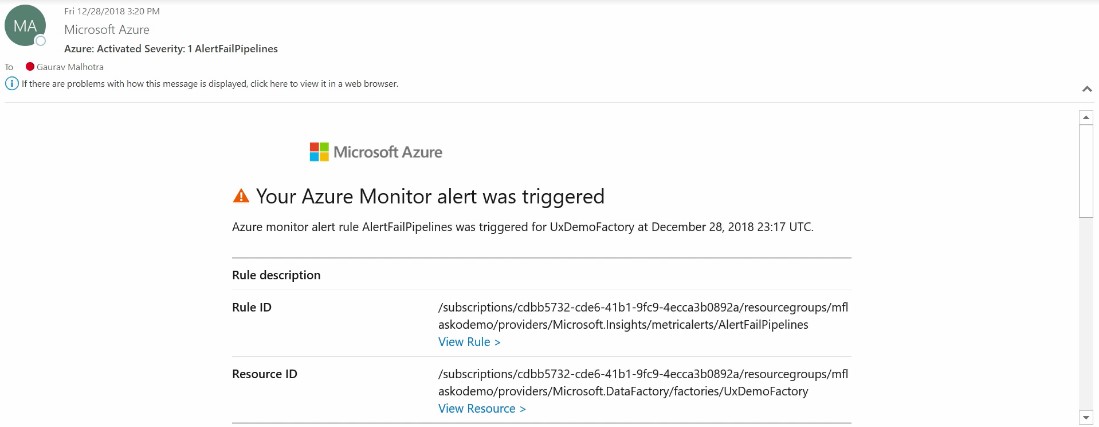
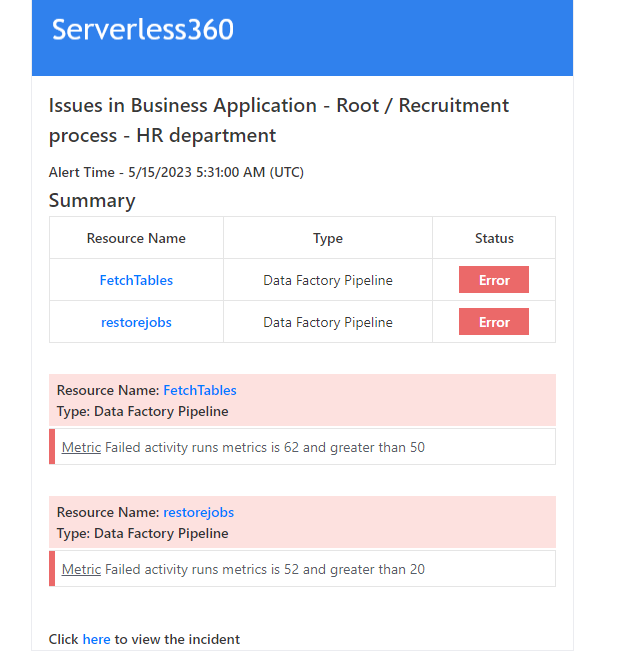
The image shown below displays a sample alert triggered using the alert rule configured in the Data Factory:
Data Visualization
Data Factory supports a wide range of metrics to understand performance, reliability, and availability. By default, the metrics are available at the level of a Data Factory. You can apply filters to visualize the data from a specific pipeline.
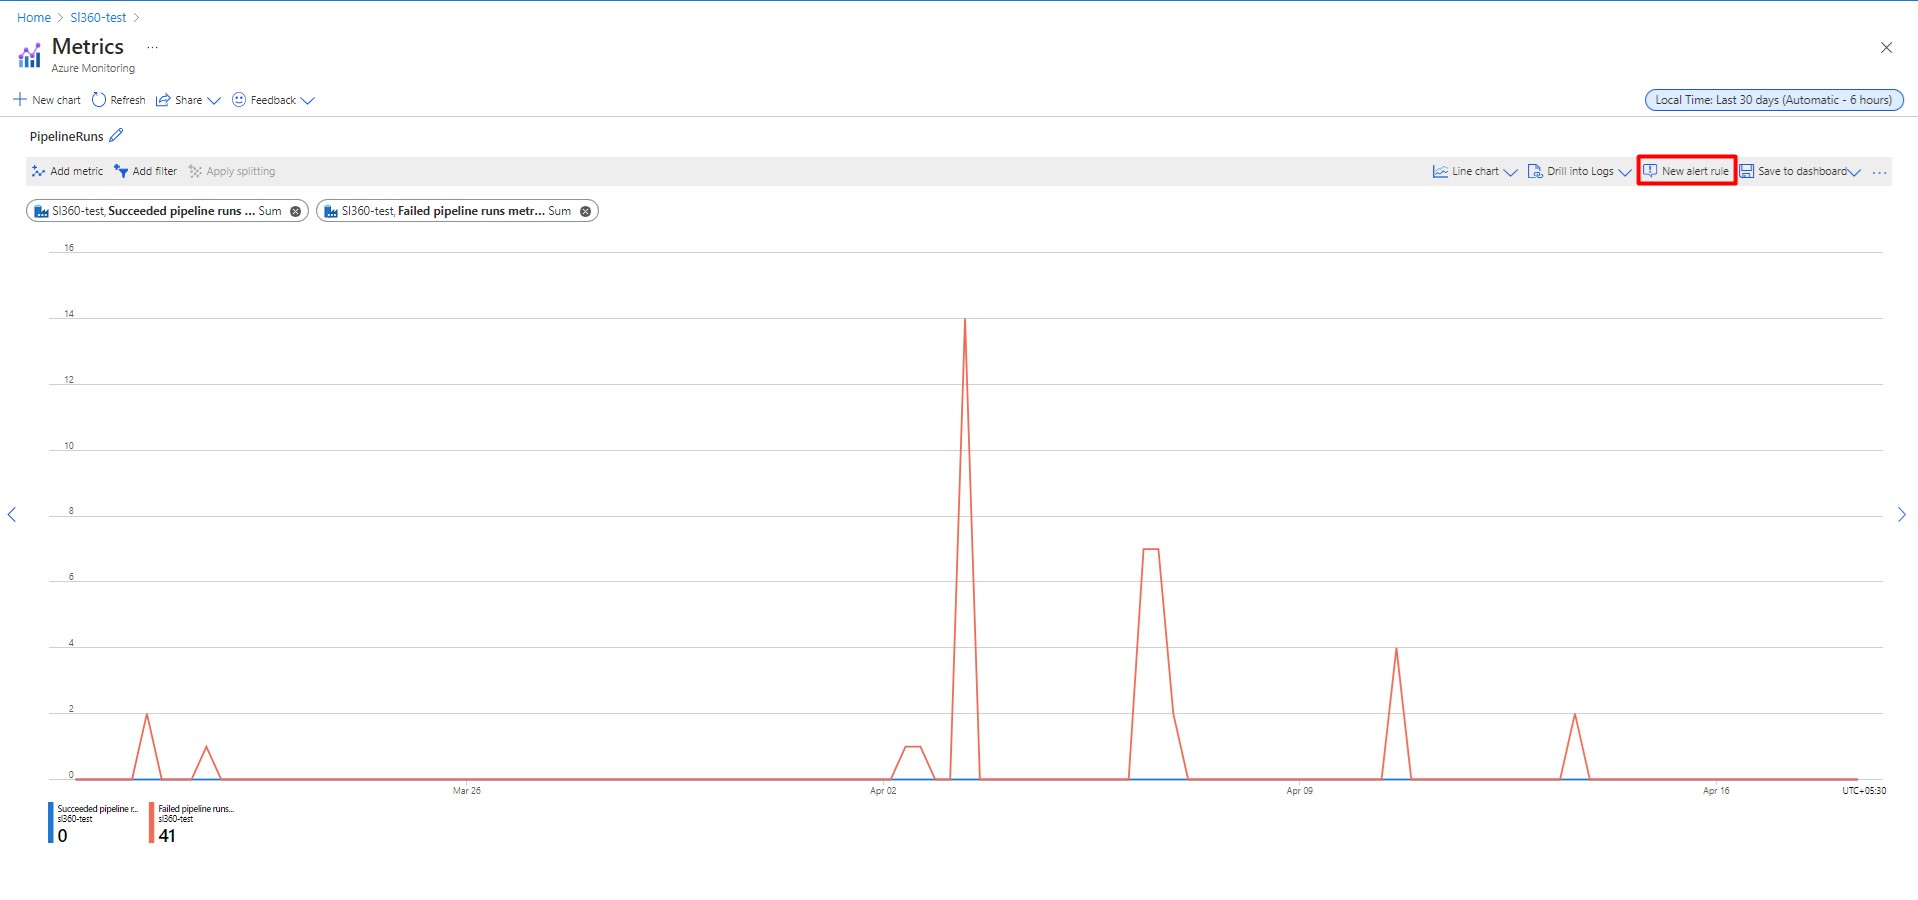
With the aid of visualization, you can configure new alert rules for monitoring at the pipeline level.
Challenges faced by Azure for pipeline monitoring
Monitoring Data Factory pipelines using Azure can present quite a few challenges:
- It is difficult for someone without expertise in Data Factory to understand the relationship between the factory and pipelines and how to manage and monitor them
- Most support cases are going to escalate to your Data Factory expert resulting in increased costs and a longer time to resolution
- It takes much effort to configure the monitoring
- Managing multiple pipelines from different data factories is complicated
Azure Data Factory Pipeline monitoring in Turbo360
Turbo360 is a robust pipeline monitoring tool that can be handled by anyone, even those with limited product knowledge. In addition, Turbo360 has an effective support team that responds almost instantly to customer questions and continues tracking customer feedback.
Turbo360 offers Azure Data Factory monitoring, allowing you to easily monitor multiple pipelines from various data factories at one location. This centralized monitoring allows improved visualization, easy access to data, and real-time insights. It simplifies troubleshooting issues, reducing the efforts spent monitoring multiple pipelines from different factories.
Business Application
Business Application is a logical container that groups Azure services, comprising a line of a business solution, and enables centralized management and monitoring.
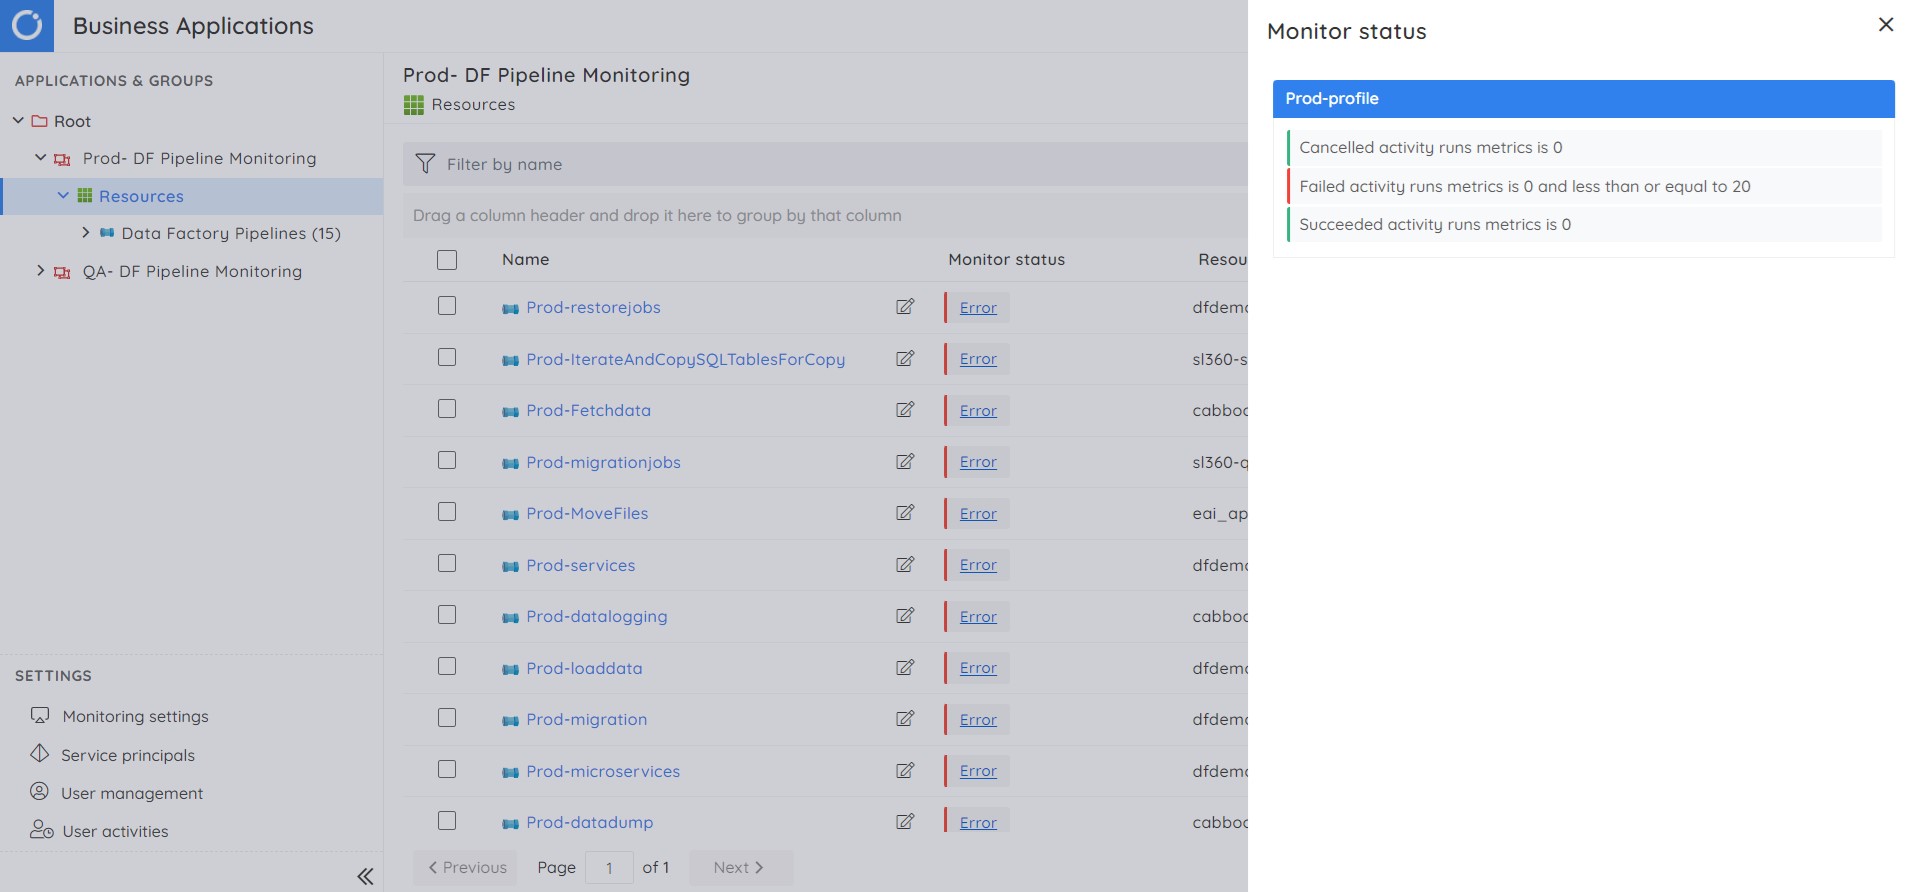
Monitoring Profiles
A Monitoring Profile is a customizable collection of monitoring rules that can be used to set up monitoring for Azure services associated with a Business Application.
Problem statement
A business orchestration that utilizes many pipelines can be challenging to map to the business function they are intended to perform. Business Applications make it possible to model a business environment and group pipelines together to make a logical container called a Business Application, which processes business data (e.g., data concerning a company’s engineering team). This allows you to manage the business function rather than the entire data factory.
Imagine the following scenario: You are responsible for managing and monitoring more than 50 pipelines that contribute to data related to the Recruitment process and more than 100 pipelines that contribute to the Onboarding process managed by the HR team at the company. It is essential to ensure that every pipeline operates properly because any failure in one pipeline activity fails the entire pipeline.
Solution
A combined operation of Business Applications and Monitoring Profiles in Turbo360 will help you implement what you need in this scenario.
The first step is to create two Business Applications that represent the different processes of the HR department, as discussed above: Recruitment and Onboarding.
Associate the necessary pipelines in the respective Business Applications. After creating the Business Application, you can use the Add option in the Resources section to associate pipelines.
The next step is creating and applying Monitoring Profiles for the Business Applications representing the Recruitment and Onboarding process.
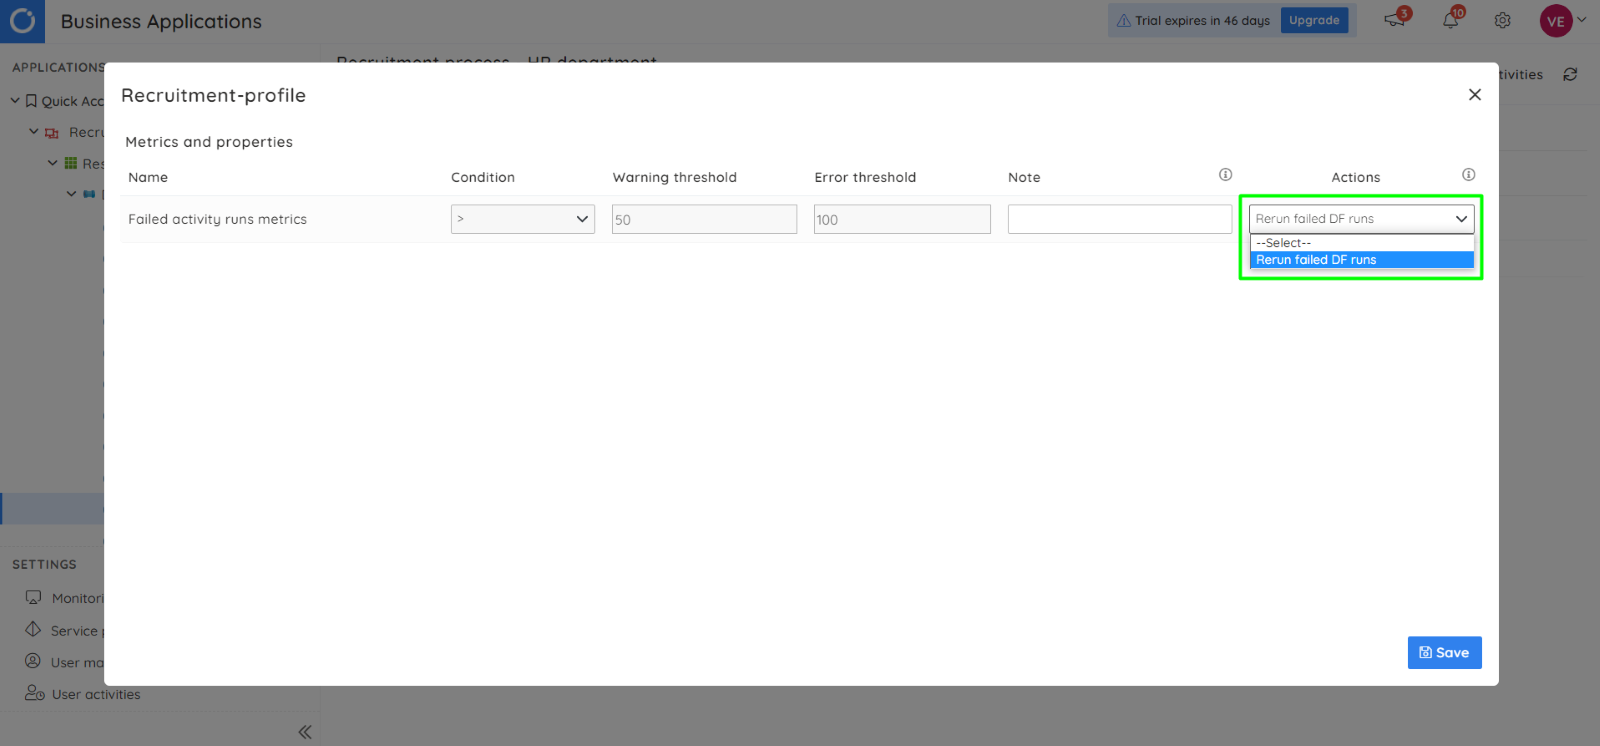
The image below illustrates the profile configuration for the Recruitment process, where the Warning and Error thresholds for the Failed runs metric are set for a higher value:
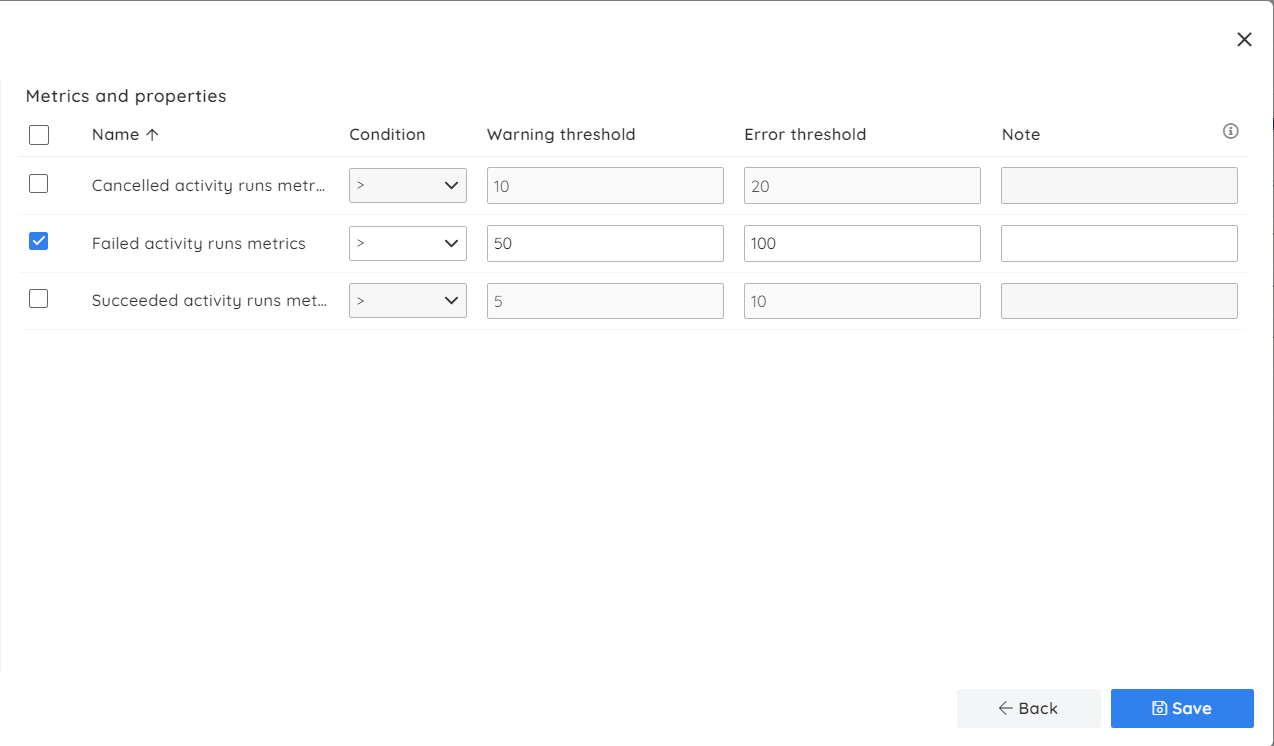
The image below illustrates the profile configuration for the Onboarding process. Here the Warning and Error thresholds for the Failed runs metric are set for a minimal value:

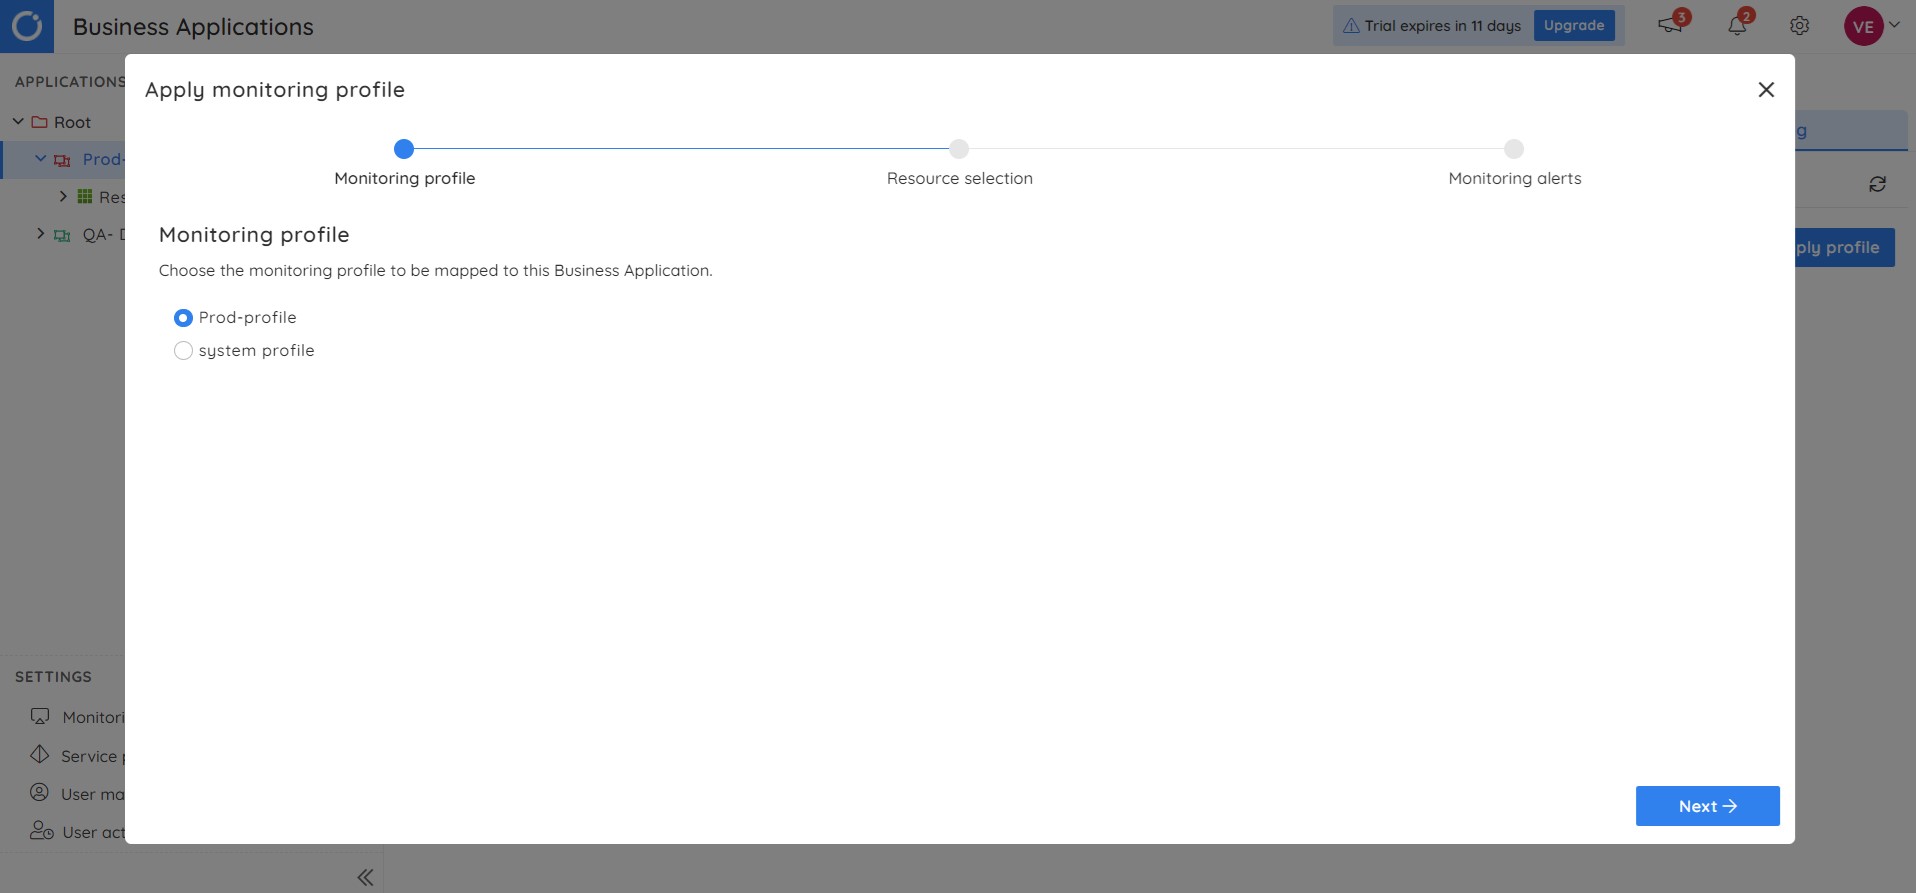
Once these profiles are created, you must apply them to the corresponding Business Applications. A Monitoring Profile can be applied using the following path in a Business Application: Monitoring -> Profile settings -> Apply profile.
Monitoring will be initiated after profiles are applied, and you will be notified of failures instantly. Following is how the status of each Business Application is represented in Turbo360. You can navigate into the Business Application, which has errors, and act on it.
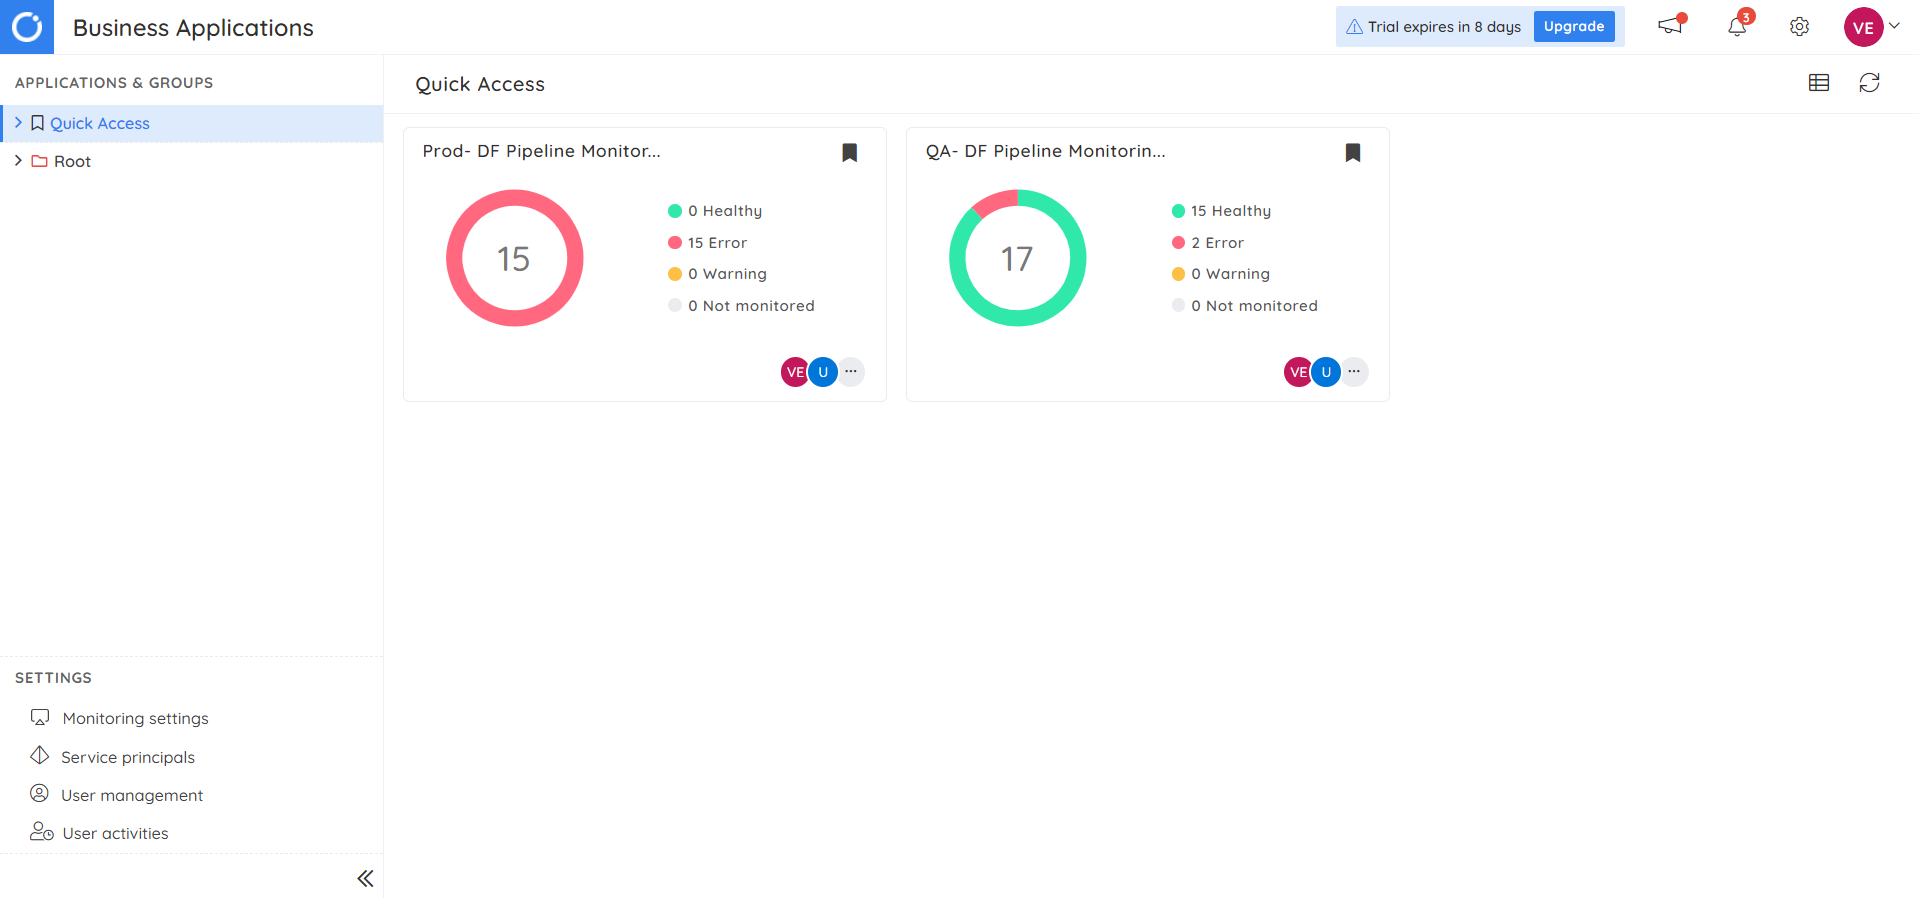
Clicking on the health state next to a pipeline will reveal the monitoring details.
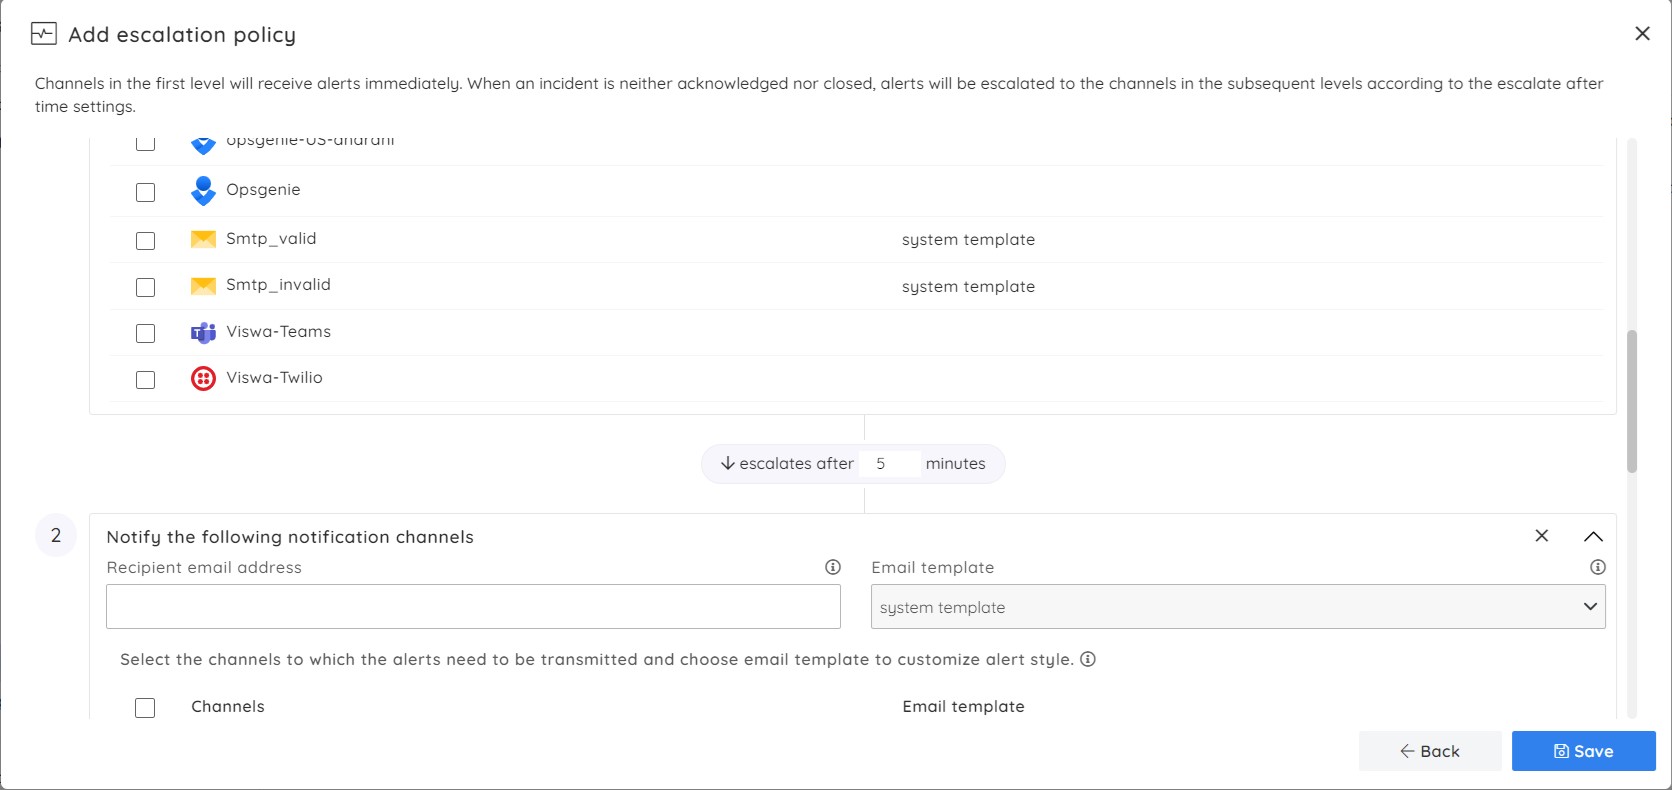
Alert Escalation
Escalation Policies can be set up at the Monitoring Profile level. Each escalation time frame can use different notification channels, such as Slack, Service Now, and Pager Duty, to transmit alerts.
Manually resolve violations
Each violation alert triggered from Turbo360 contains a link to the violated resources in the respective Business Application, which will navigate you to the appropriate resource in Turbo360.
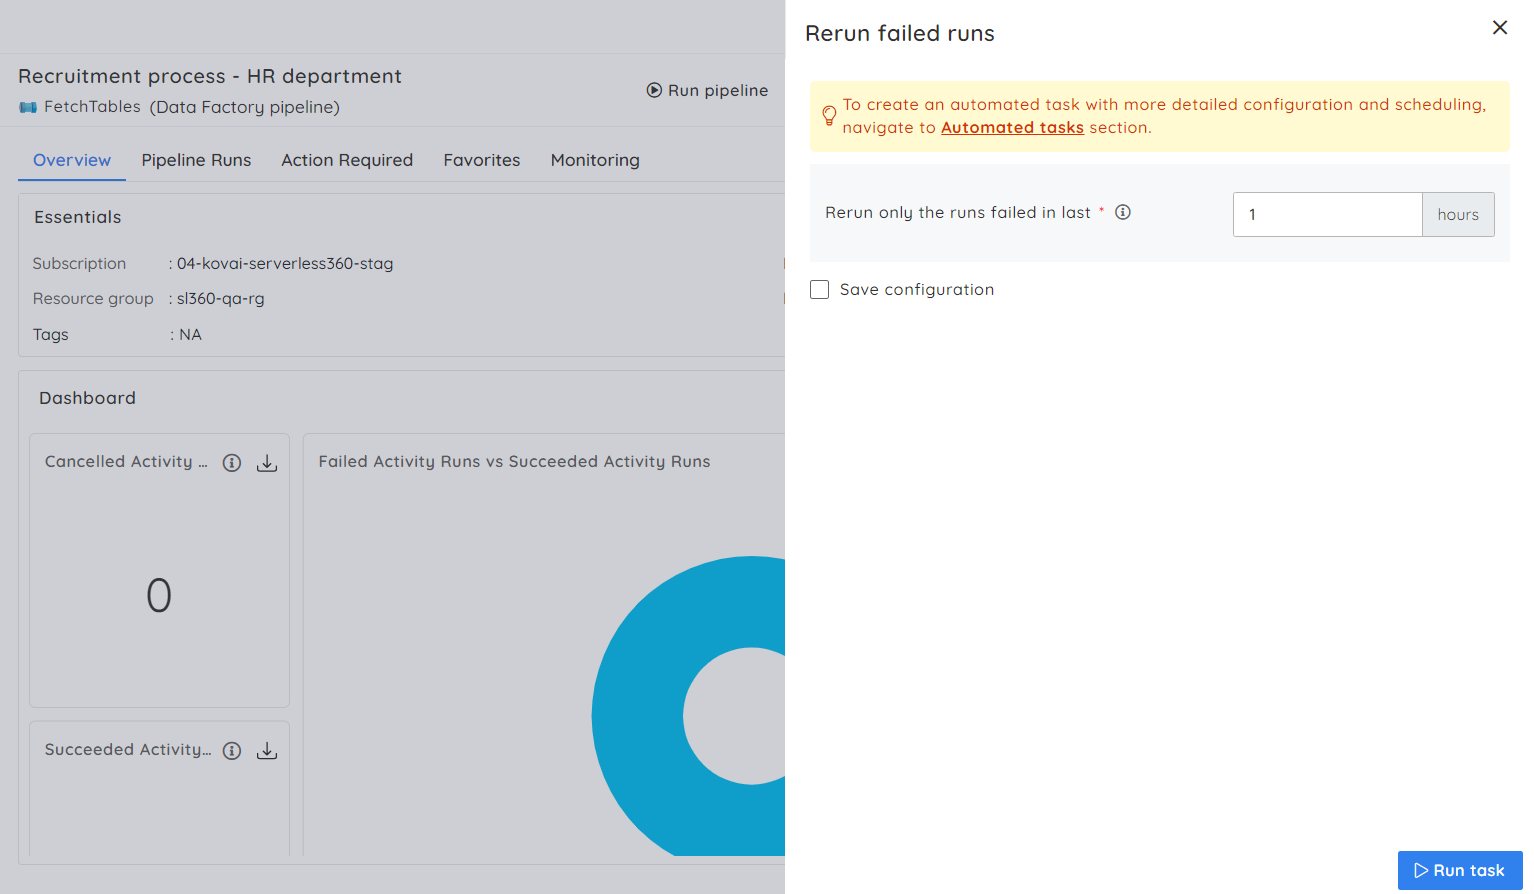
The pipeline can be manually rerun to resolve the violation after navigating the violated resource.
Automatically resolve violations
In addition to failure monitoring, you can specify an action to be taken in case of a rule violation. The combined event of an automated action with a rule violation saves the time taken over manual intervention and improves business continuity.
For example, suppose you have ‘n’ failed activity runs in the past few hours and want to rerun them when the n value reaches the configured threshold. A task can be configured to rerun failed pipeline runs in a specific time frame and mapped to the rule violation.
Let’s put it all together
Microsoft Azure provides pipeline monitoring via Azure Monitor by configuring a set of rules and alert logic shared by all pipelines available in an Azure Data Factory. The alert logic helps to detect data quality issues and performance bottlenecks. Managing multiple pipelines from different data factories requires repeated alert configurations multiple times, making it challenging to track the alerts.
By combining pipelines from multiple data factories into a logical container and using Monitoring Profiles to track the failures, Turbo360 increases its edge over Microsoft Azure. This helps to identify any issues quickly and proactively take corrective action, reducing downtime and increasing productivity. Having features like Automated Reruns in case of violations will be very useful for keeping pipelines intact.
To sum up, Turbo360 is a mature product to monitor and manage Data Factory pipelines. This allows you to delegate support from Azure experts to IT operations, lowering support costs and freeing up resources to work on delivering new solutions.
Try Turbo360 for free!