Over the last few years, Microsoft has built excellent tooling around different technologies. Today, everything is available and achievable through the Azure Portal, which helps manage complex solutions. However, this brings in challenges when it comes to managing the distributed resources. The struggle to keep track of messages or know the flow of messages through these distributed resources is growing day by day.
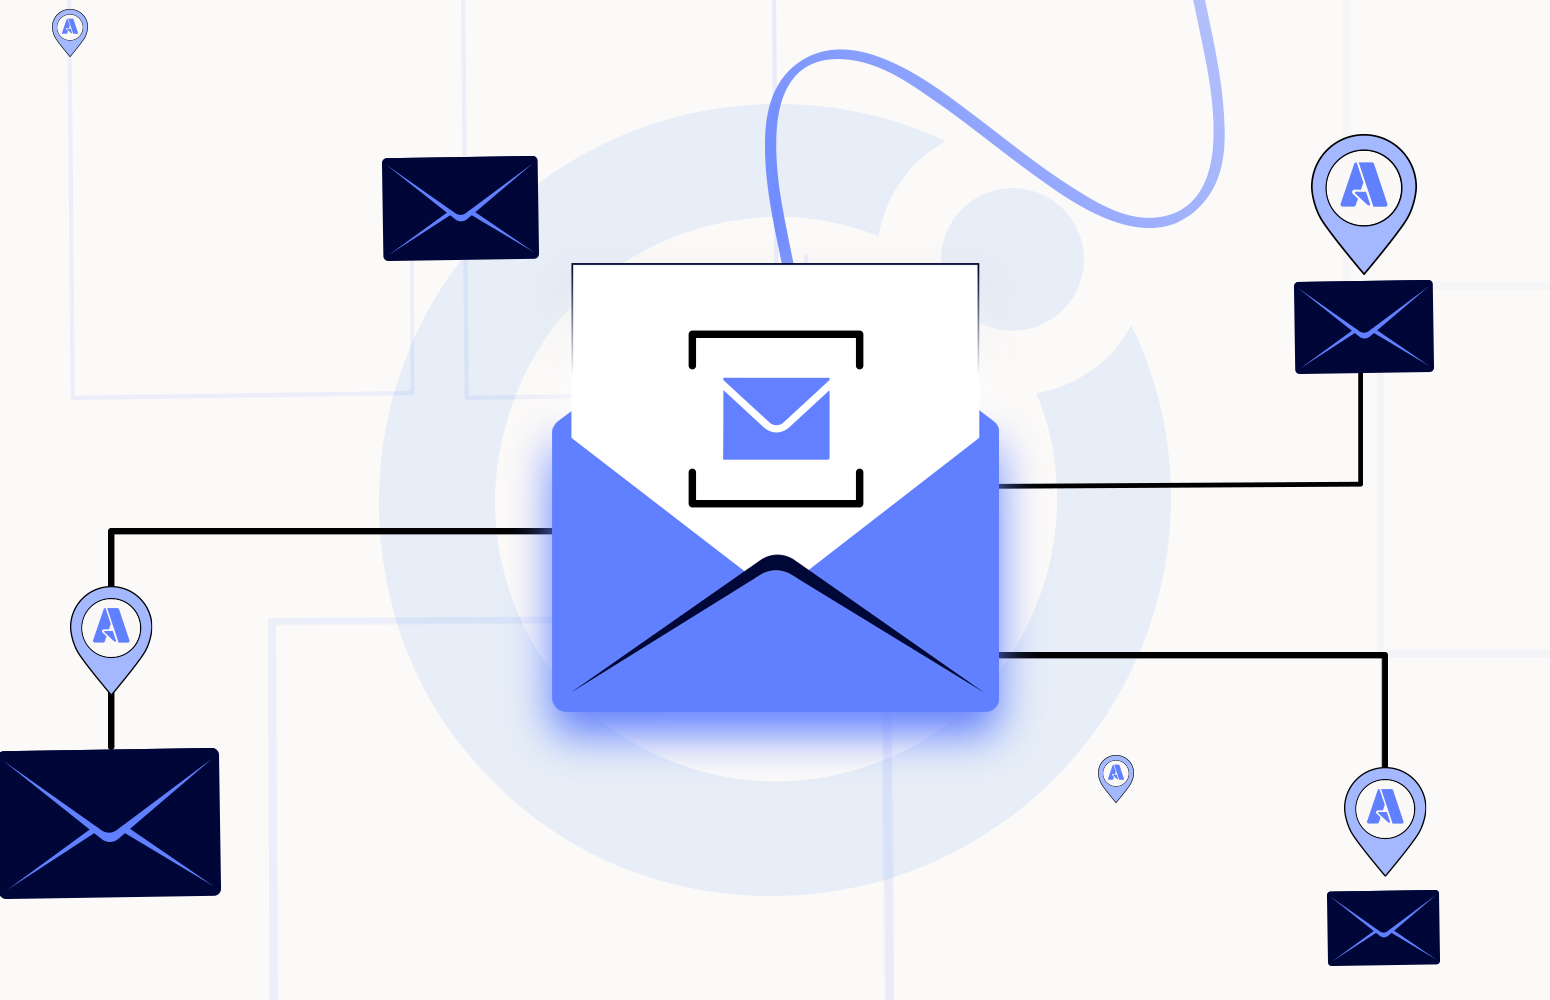
In most Integration services, Service Bus acts as a message broker to transfer data from a source to a destination.
Azure natively supports distributed tracing using Application Insights agents or SDKs for .NET, .NET Core, Java, Node.js, and JavaScript. When a Service Bus receives a message, it receives the data processed earlier by another system or scope. After receiving the messages from the Service Bus, the subscriber also performs a set of actions on the received data. To correlate these events of publisher and subscriber, there should be a unique property in the message which can be leveraged as a trace property for the End-to-End tracing.
Microsoft Azure Service Bus messaging has defined payload properties that producers and consumers should use to pass such trace context. The protocol is based on the HTTP Correlation protocol. Azure Service Bus SDK has a property that we can leverage to trace the messages
- Diagnostic-Id – Unique identifier of an external call from source to the queue
Interested to know how to achieve end-to-end tracking at ease? Talk to our experts
Application Insights
Application Insights is a native offering from Azure, which helps to correlate events. These events can occur within the same application process or across several application processes
How Application Insights works is you insert a small package to your application and set up the Application Insights resource within Azure, thus sending the data to Azure to collect information. The business process is monitored, and it sends telemetry data to the Insight portal.
Querying the Distributed Traces
After a comprehensive design of the tracing approach and its implementation, we can now query our distributed traces in a meaningful way.
Once the Service Bus published the message and has logged tracing events, logs in Application Insights can be queried using the Kusto query language.
Application Map from Application Insights
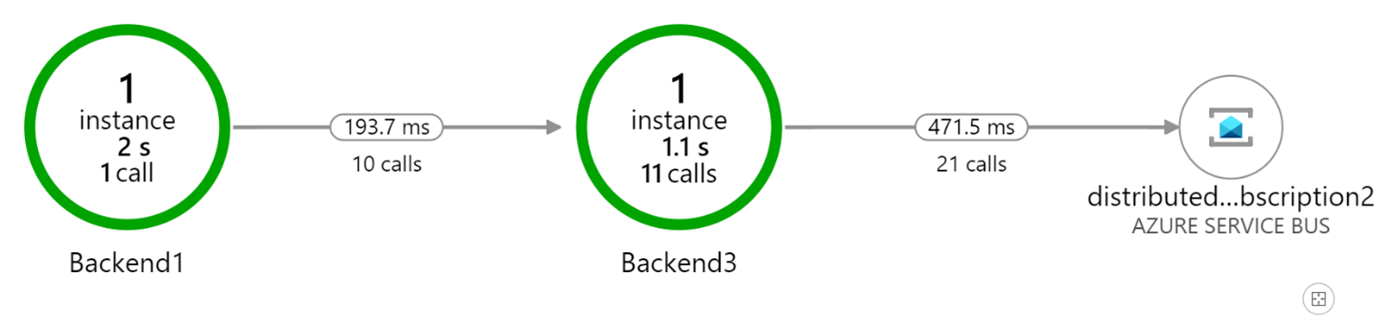
Application Map helps you spot performance bottlenecks or failure hotspots across all components of your distributed application. Each node on the map represents an application component or its dependencies. If your app uses Azure services, you can click Azure diagnostics, such as SQL Database Advisor recommendations.
If you have a service bus pushing messages to a Function App or Logic App, this dependency can be viewed with the help of an Application map. This Application Map helps us understand how a service bus is a connecter to another resource.
Here is a sample of how the connectivity will be shown to a user.
You can use all of this Azure service to trace messages in a service bus. But the problem here is you need to reply or maintain multiple places. We don’t have a single place where we can see the entire flow of messages. When we consider enterprise integrations, their footprint will not be in Azure alone. They will have their data coming from an On-prem system or end up in an on-prem system. How do we correlate these hybrid integrations and visualize them in a single place?
Well, Turbo360 has Azure distributed tracing tool to track the flow of messages across your Business Process. You can create a flow to represent your business process and instrument it to trace the message. Once the instrumentation is done, all the data your business process tracks will be automatically displayed in Turbo360.
Achieve end-to-end tracking across Azure resources and hybrid integrations. Try free trial
End to End tracking in BAM
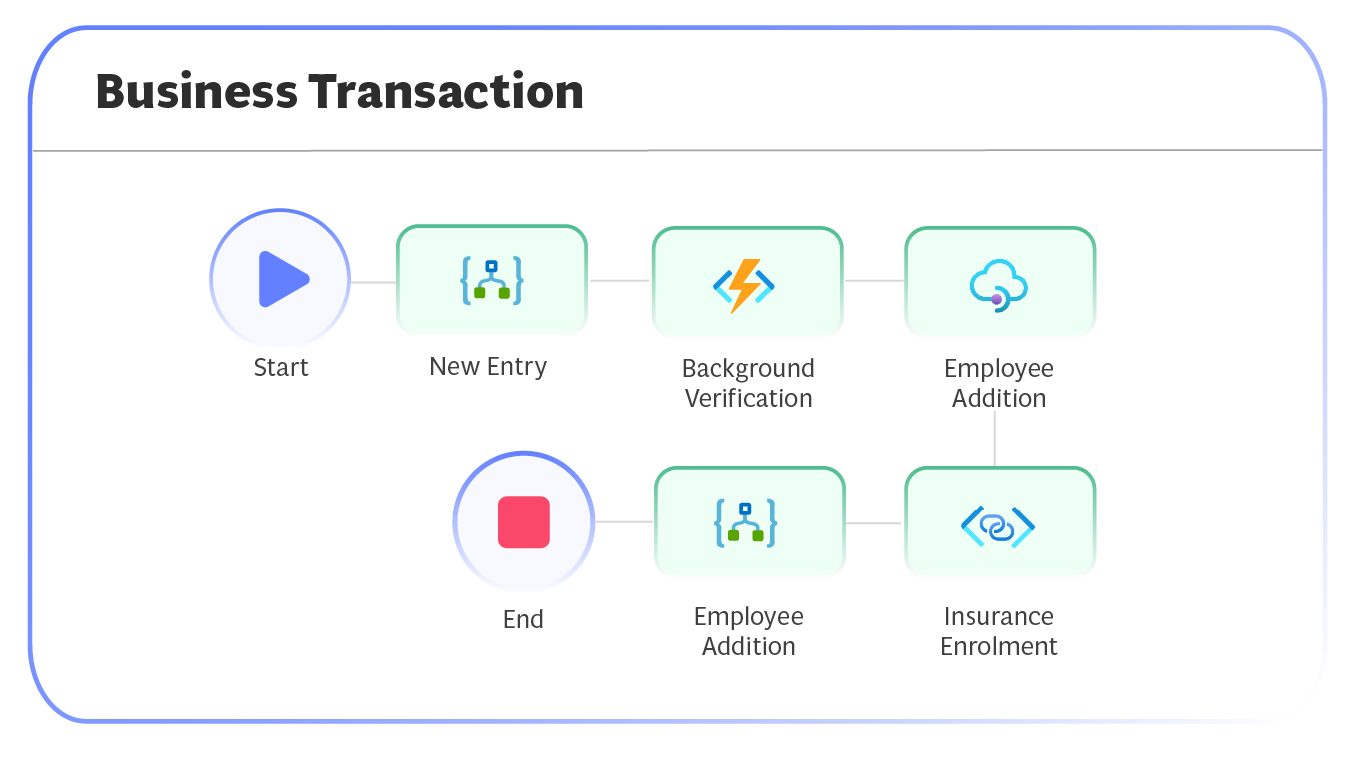
Bring maximum visibility of your integration solution to functional support teams by defining properties to track business values at run-time. Easily correlate the flow of data within your system. Moreover, it allows you to visualize your business transactions in a graphical representation and detailed information. Furthermore, it also enables the visualization of a specific and more complex business process on how all milestones/transactions are executed in a particular sequence.
Associate Business Processes with Turbo360 to Track data
To start tracking your messages, you need to create a business process in BAM and picturise the flow your business process possess. This business process helps Turbo360 to understand how your Business Process has been designed. You can also have multiple Business processes, and each business process can have various transactions.
Instrument your Business process for Tracking
Once the flow has been created, the next step is to instrument your business process to make it suitable for Tracking. If you have completed your integration using Logic apps, we can leverage the custom connector facility from Azure to track the messages. If you have other components like Custom Apps, Function Apps, APIM, we can leverage the .Net library and SDKs from Turbo360.
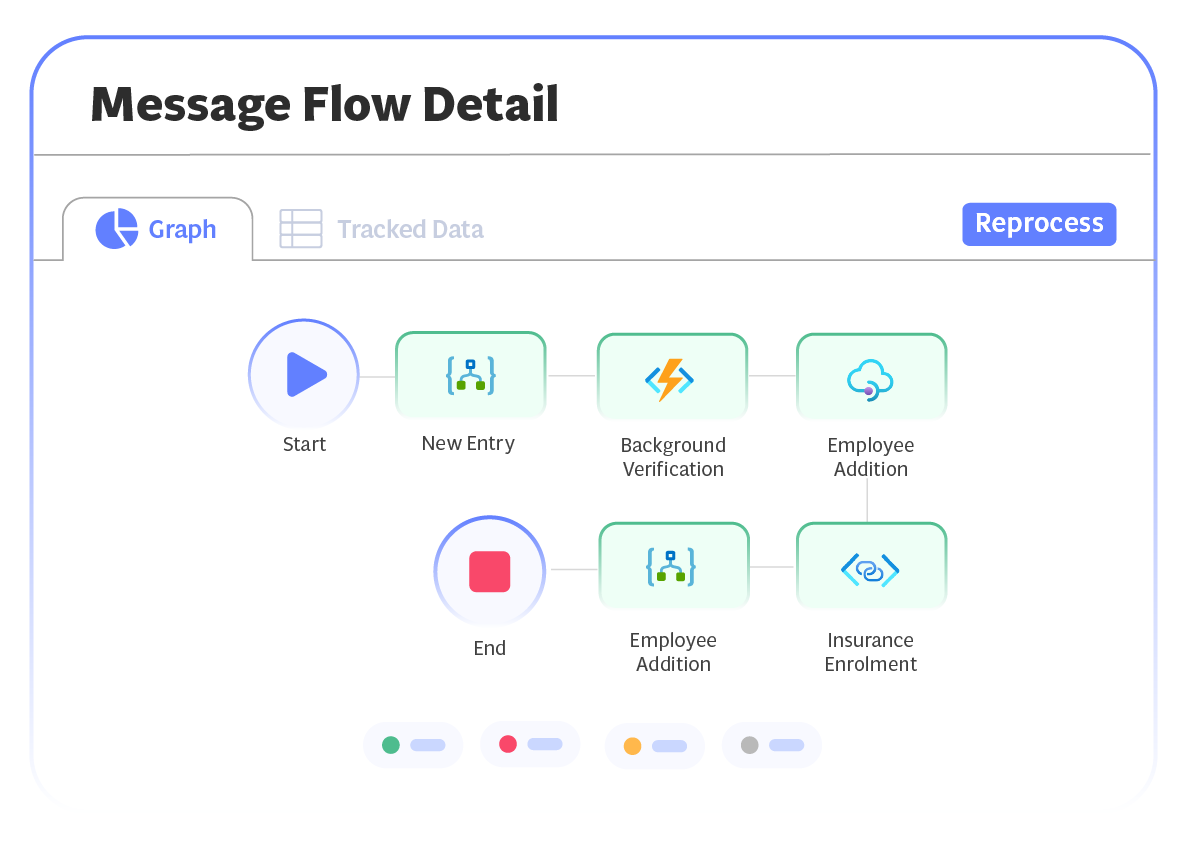
Visualize the flow
When the instrumentation is done, Turbo360 tracks all the data your business process is processing. You can visualize the flow in which the message has travelled. Furthermore, it also provides the possibility to visualize a specific and more complex business process on how all milestones/transactions are executed in a particular sequence
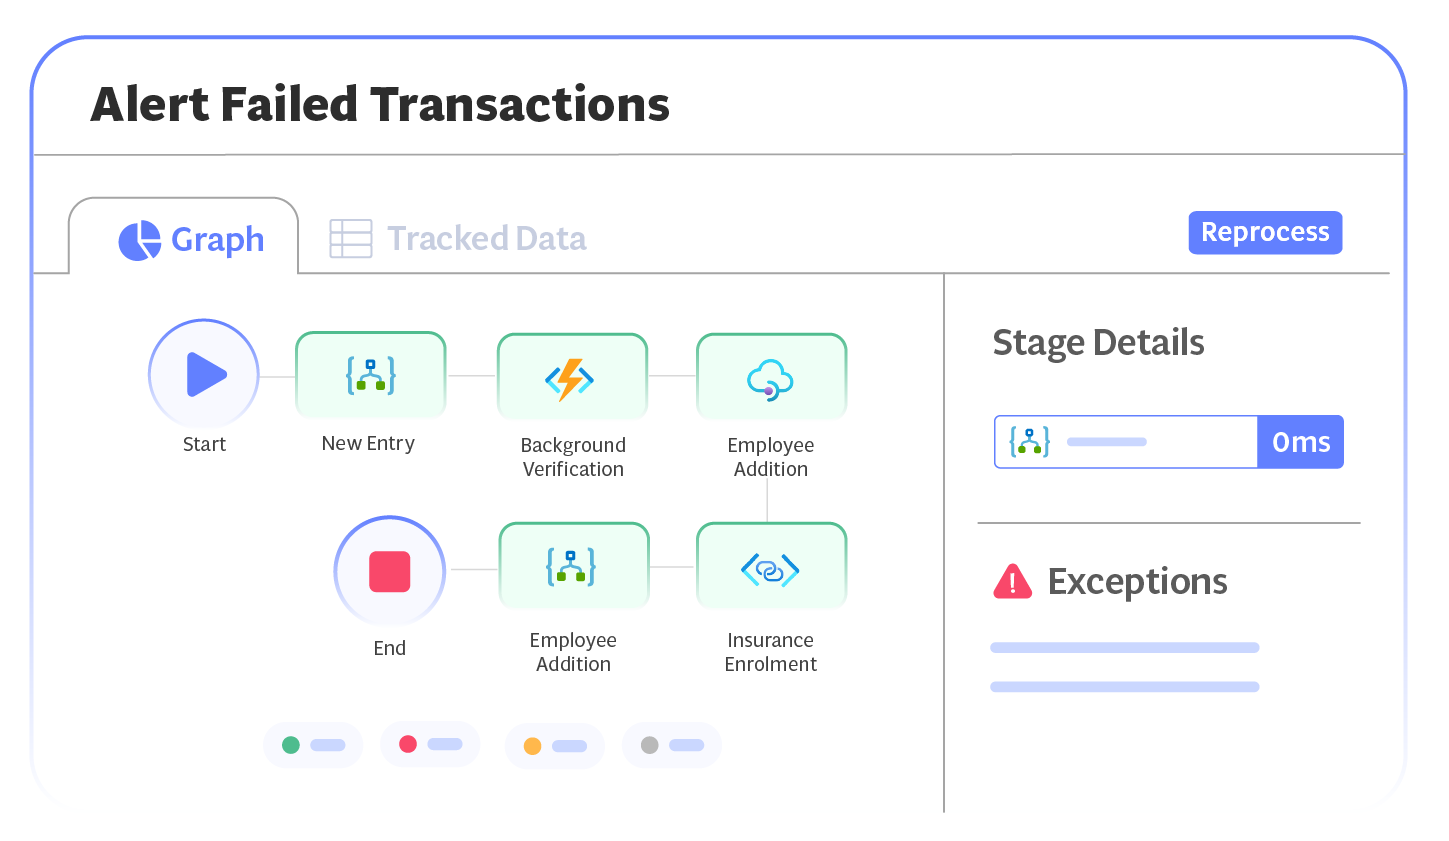
Spot failures in your Business Process
Spot the failures in your business process and know where the failure has occurred in your distributed components.
Search for Narrowed results
Search your transactions with some unique property in your message to spotlight that specific transaction.
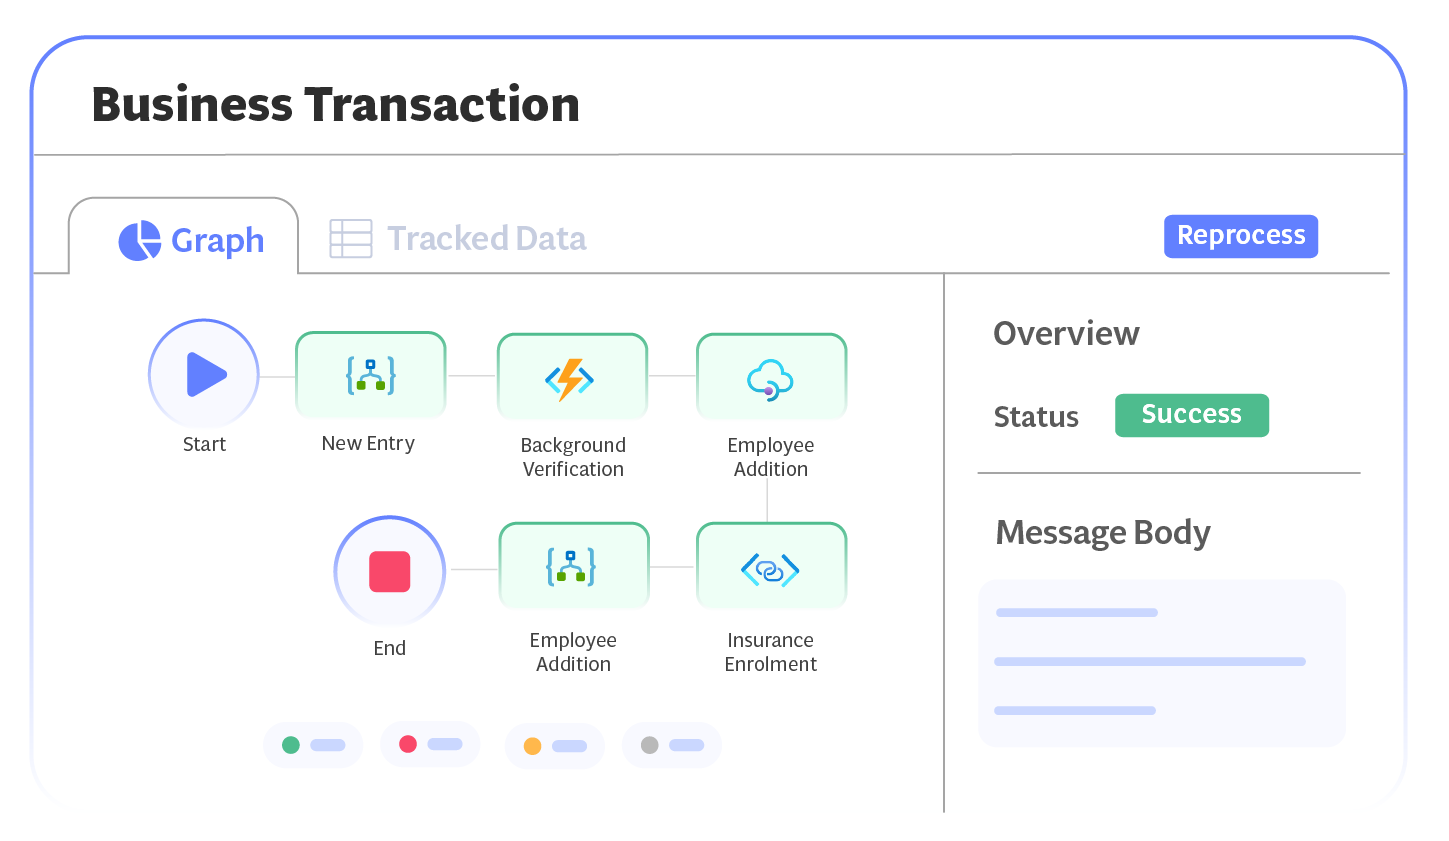
Investigate the Messages processed
At any point in time, if you want to know the exact content that your business process has processed for a transaction, you can view it from the tracked window. Download any archived message directly from the Turbo360 portal at ease.
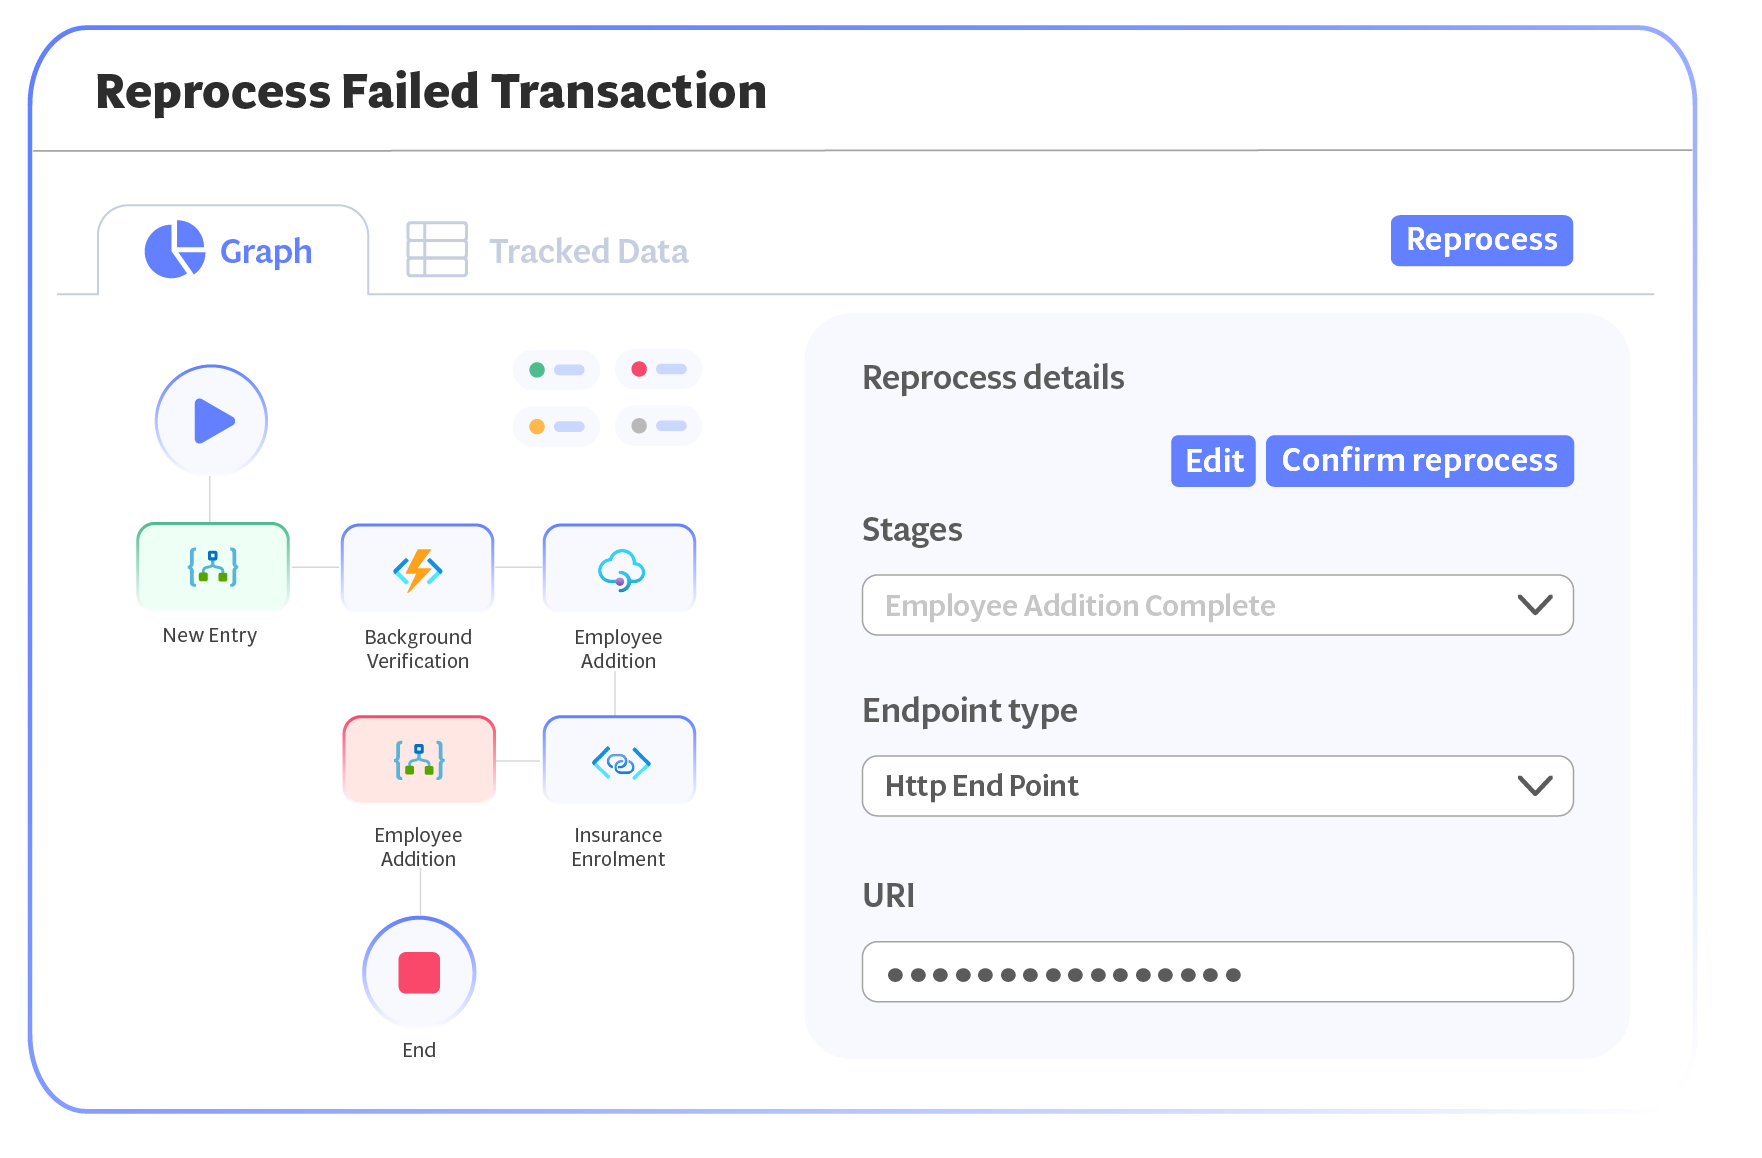
Reprocess a transaction
Have a failed transaction? You can retry single or multiple transactions right from Turbo360. Allow your support people to investigate the failure and reprocess it themselves without depending upon your skilled Azure resource.
Conclusion
Be it distributed tracing tools or out-of-box tracking capabilities by Turbo360, it is always to keep track of messages in our business. This Tracking helps us to understand the performance of a business and help to reduce the complexity.