One thing support engineers would very much like is a single pane of glass to have an overview of everything running in a production environment. When looking at cloud-native integrations between systems and services, it is no different. Cloud-native integrations in Azure are composite solutions build with Functions, Logic Apps, Service Bus, and API Management services. To monitor a composite of these services requires knowledge of the available monitoring capabilities in Azure and an intuitive way to set it up. Or as an alternative, you buy an off the shelve product to fulfill the monitoring requirements of the operations team. In this blog post, we like to discuss how to centralize monitoring for cloud-native integrations and how to have a centralized view of cloud-native integration solutions, which can be challenging.
Scenario
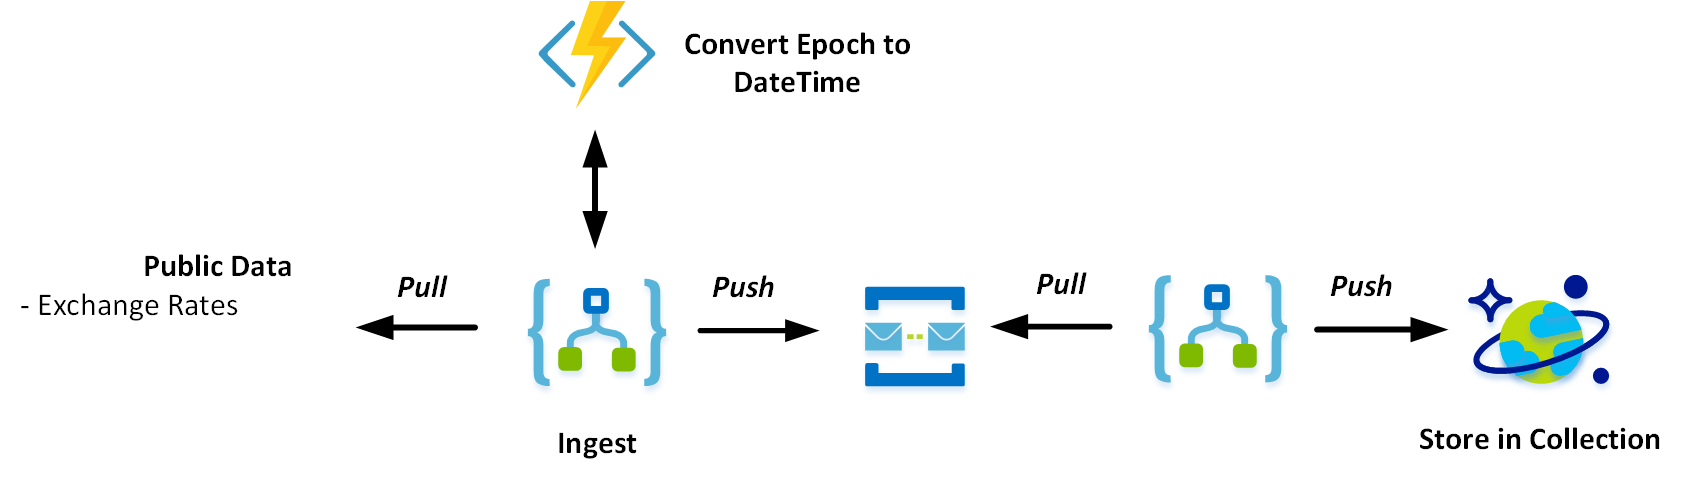
Assume you have a data ingestion solution with a Logic Apps, Service Bus and CosmosDB to create a dataset over time for analysis. The first Logic App has a schedule trigger and runs every hour, calling a public endpoint for exchange rates, consuming the response, convert Epoch Time to DateTime with a function, and send it to a service bus queue. Next, the second Logic App picks up the message and stores it in a Cosmos DB document collection.
Azure Monitoring Services
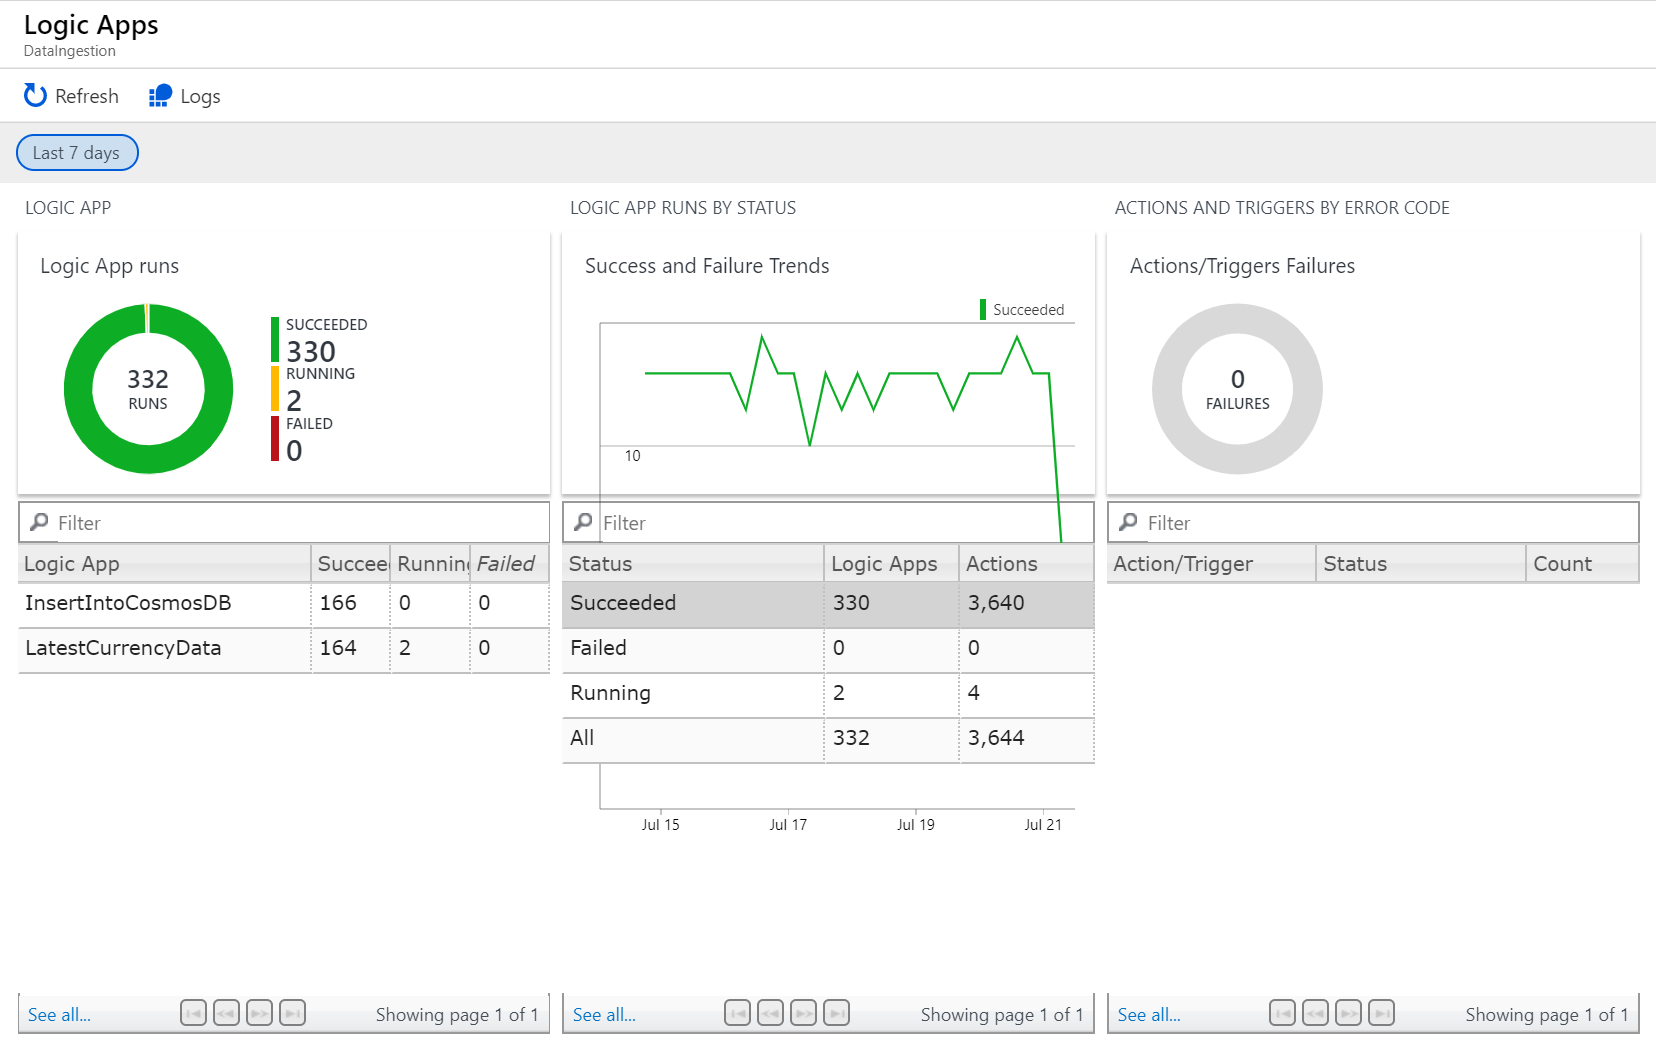
In the scenario from the previous paragraph, you see several Azure Service, each with their monitoring capabilities. You can monitor Logic Apps using Azure alerts, Log diagnostics, and leverage the Operations Management Suite (OMS) capability for Logic Apps.
Furthermore, with Application Insights, you can monitor your Azure Functions and leverage the built-in monitoring for Cosmos DB (see screenshot below).
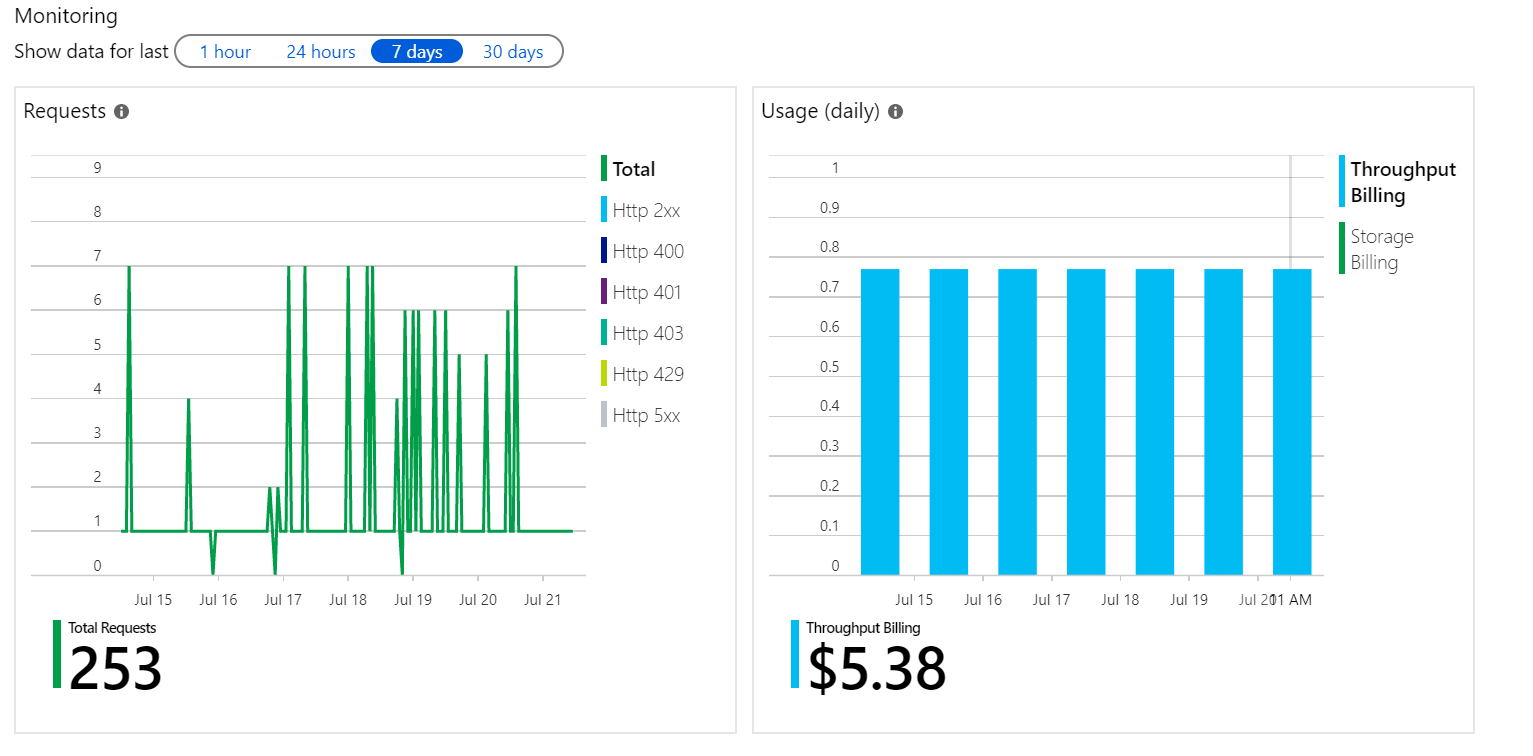
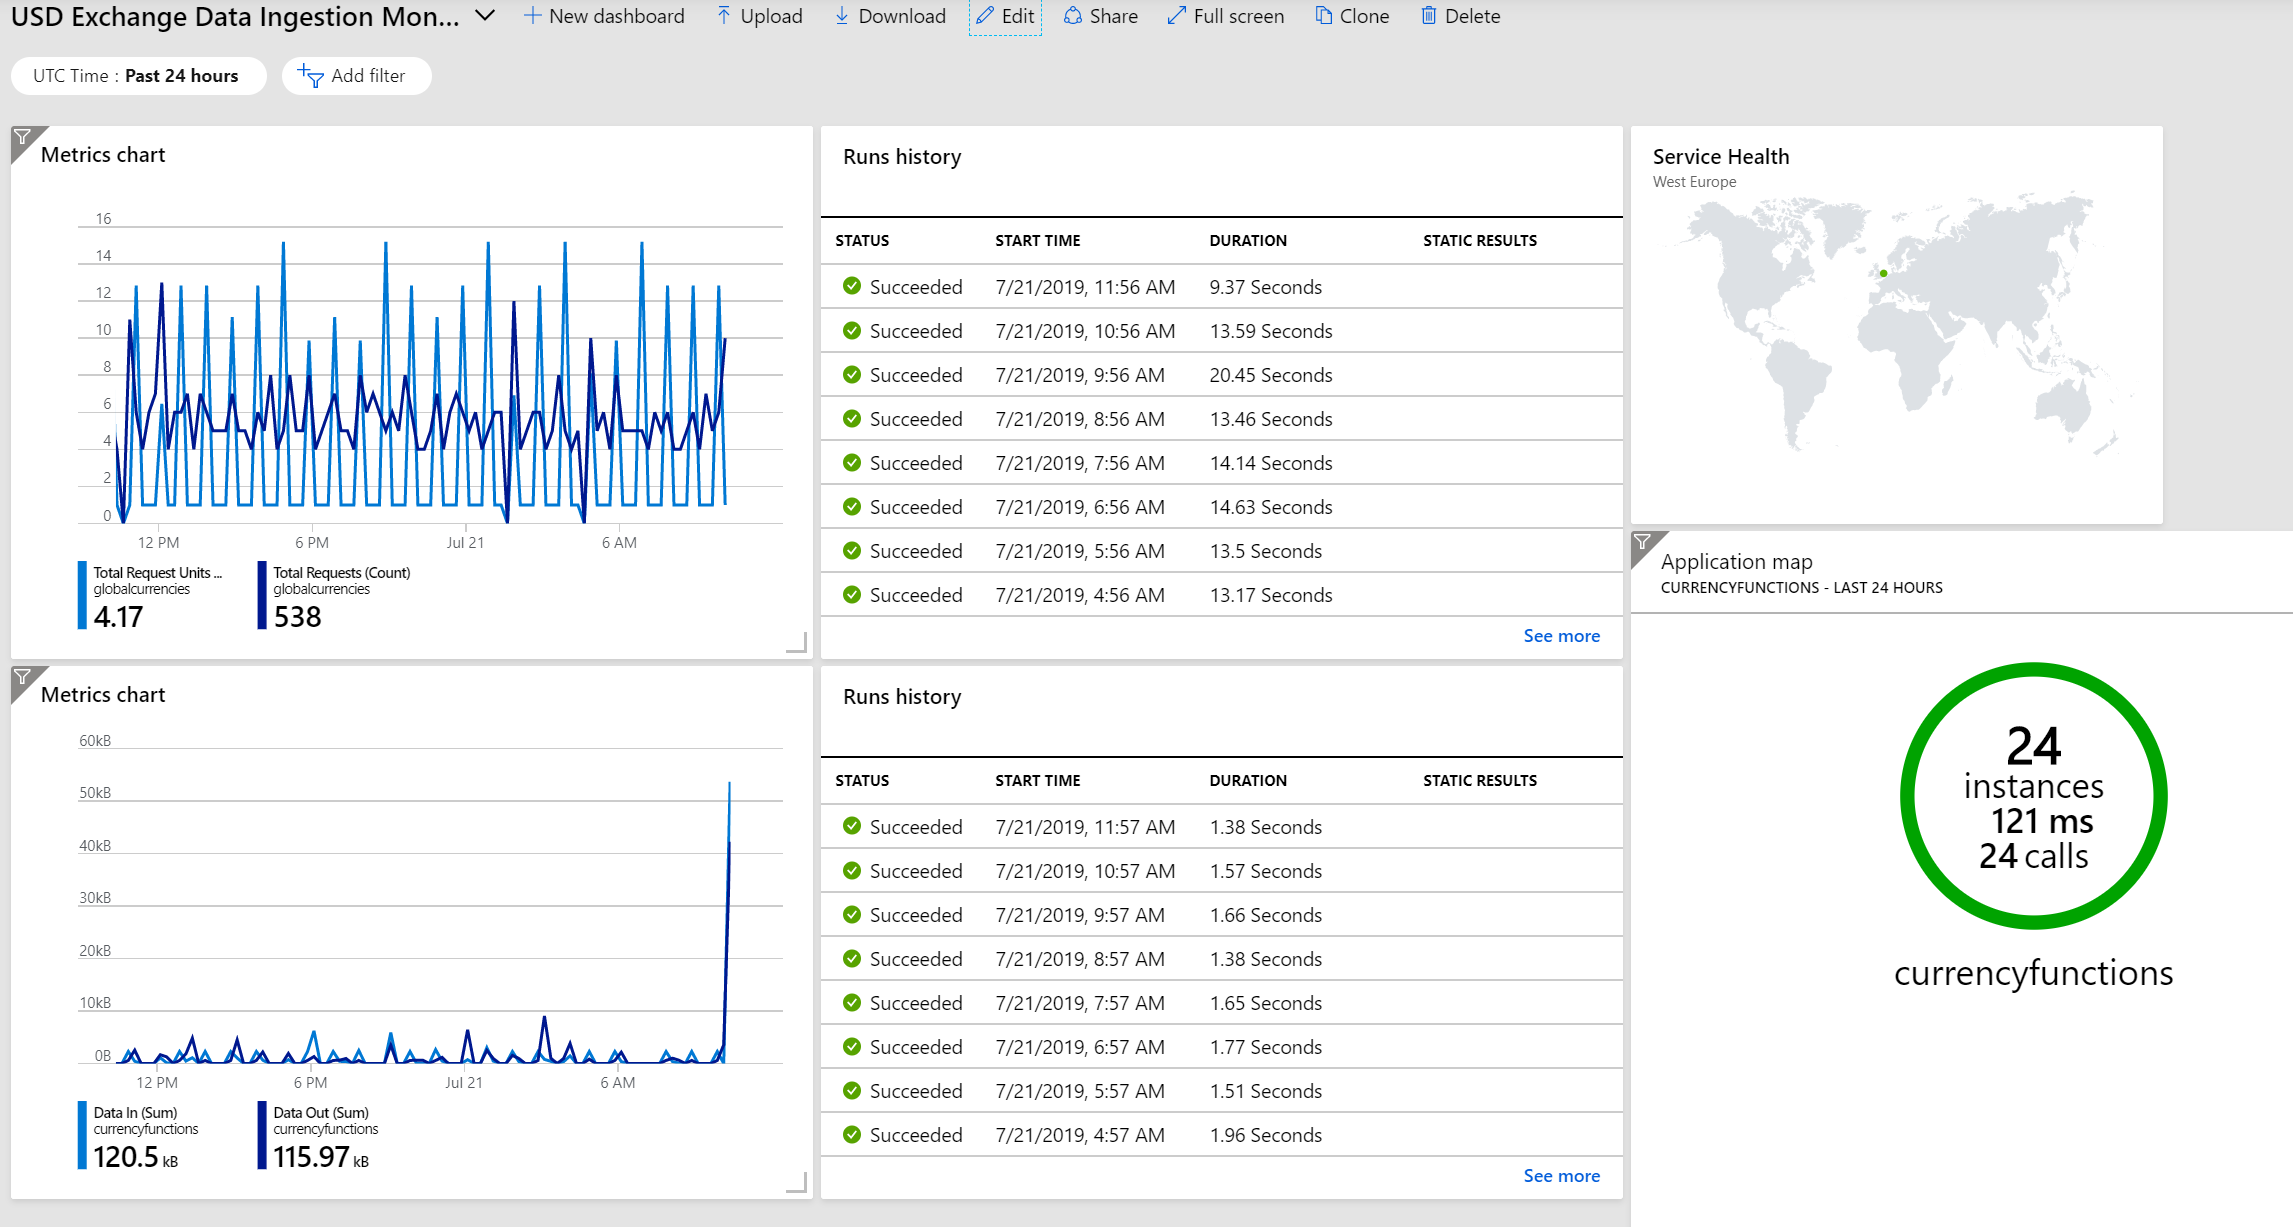
Through the Azure Portal, you can create a consolidated view of various metrics, alerts, availability and more by creating a custom dashboard. This dashboard can give you a centralized view of your integration solution.
However, it requires knowledge and experience with the Azure platform and its services, understanding the meaning of the metrics, and when to take action.
Furthermore, you cannot group monitoring for each cloud-native integrations that gives you a good overview. You probably end up creating a custom dashboard for each integration solution.
Besides dashboards, metrics, run history and other monitoring capabilities in Azure, you can also create alerts when a Logic App run fails, or Function App is unavailable. With these rules, you can set up action groups ( a collection of notification preferences defined by the owner of an Azure subscription) and notify support staff to any particular issue with your cloud-native solution.
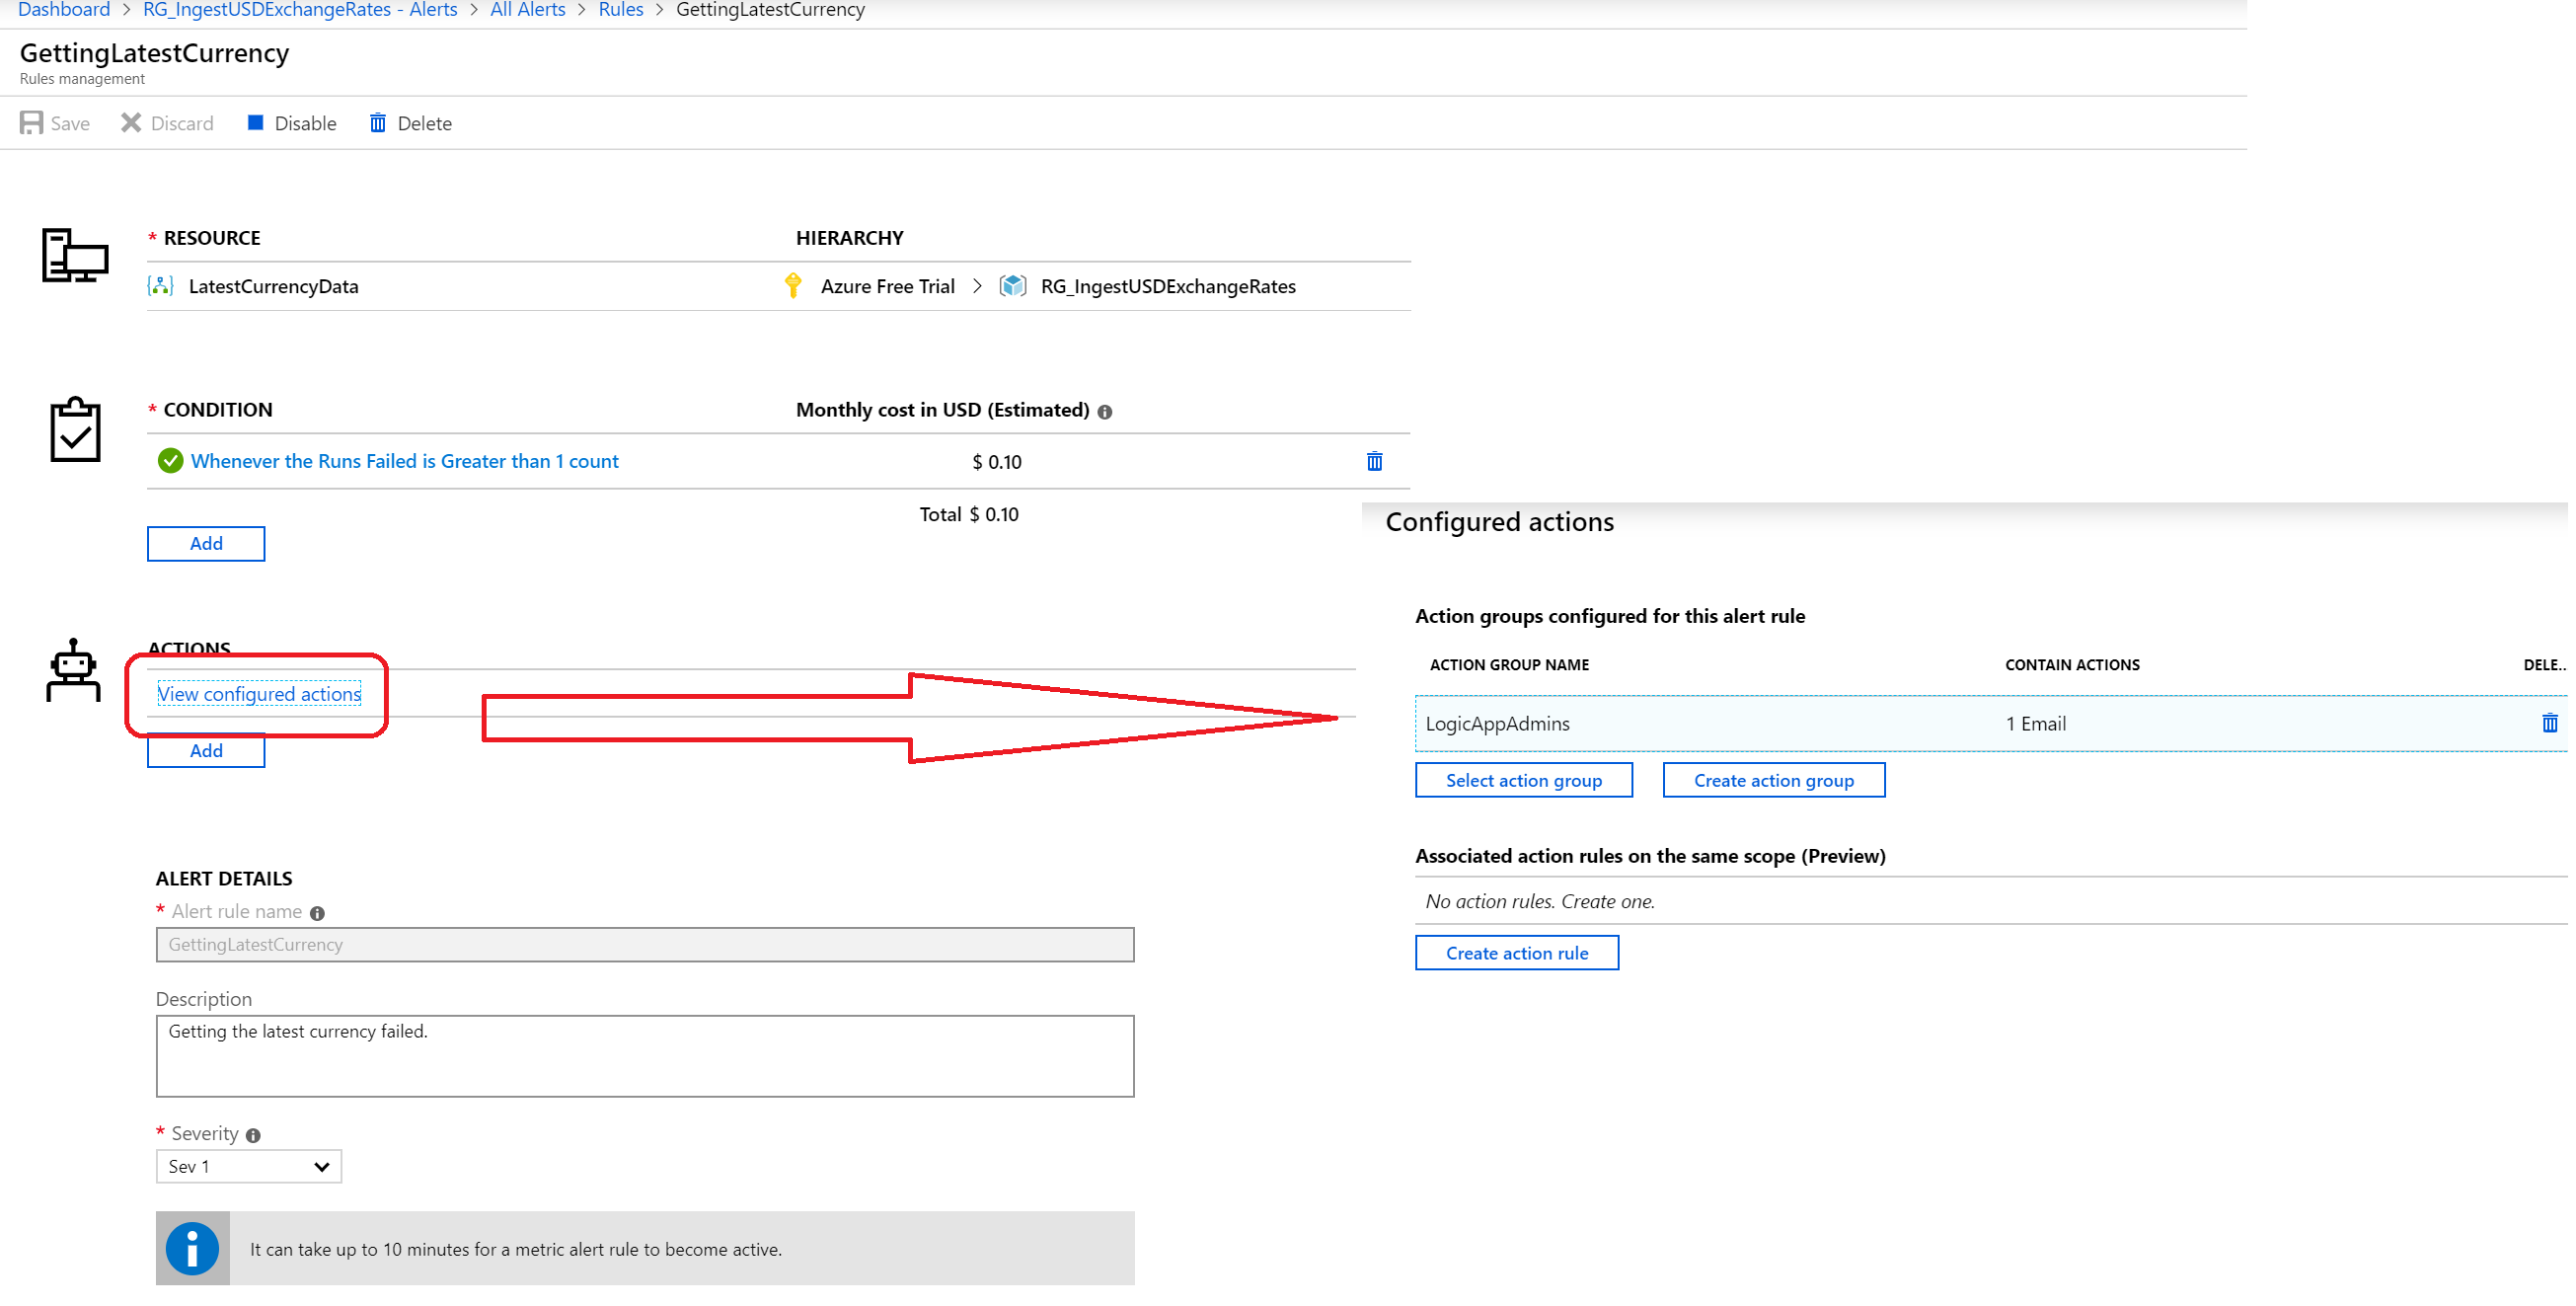
In the screenshot above, you see the configuration of an alert – it will send out an email when the GetLatestCurrency Logic App fails. Note that you will create various alerts based on different rules and potentially different action groups.
Monitoring – Centralized View
In the scenario paragraph, we mentioned a few options you have to monitor a cloud-native integration solution leveraging what the Azure platform has to offer. The possibilities are useful when you are a tech-savvy Azure developer or operational professional. But what if you have less experience, need to monitor a few too many integration solutions, and need to act promptly. Does Azure provide you with the tools and dashboard to monitor the integration solution centrally? Or can you leverage a service that does? Question the latter is yes – there is a service available called Turbo360. Turbo360 is a Software-as-a-Service solution providing you with a comprehensive way to manage and monitor your Azure Serverless Components, i.e. composite cloud-native integration solutions.
You can logically group your integration solution into a Composite Applications that represents a so-called Business Applications. A Composite Application is a logical entity that you can use to group Azure Entities such as Queues, Topics, Relays, EventHubs, Logic Apps and Azure Functions that consist of a Line of Business Application (LOB) in your cloud-native integration solution. These entities can be from different Azure Subscriptions and namespaces.
With Turbo360, you can monitor several Business Applications, create a range of monitors for each of them, and have a consolidated view.
For our scenario, we can create several monitors:
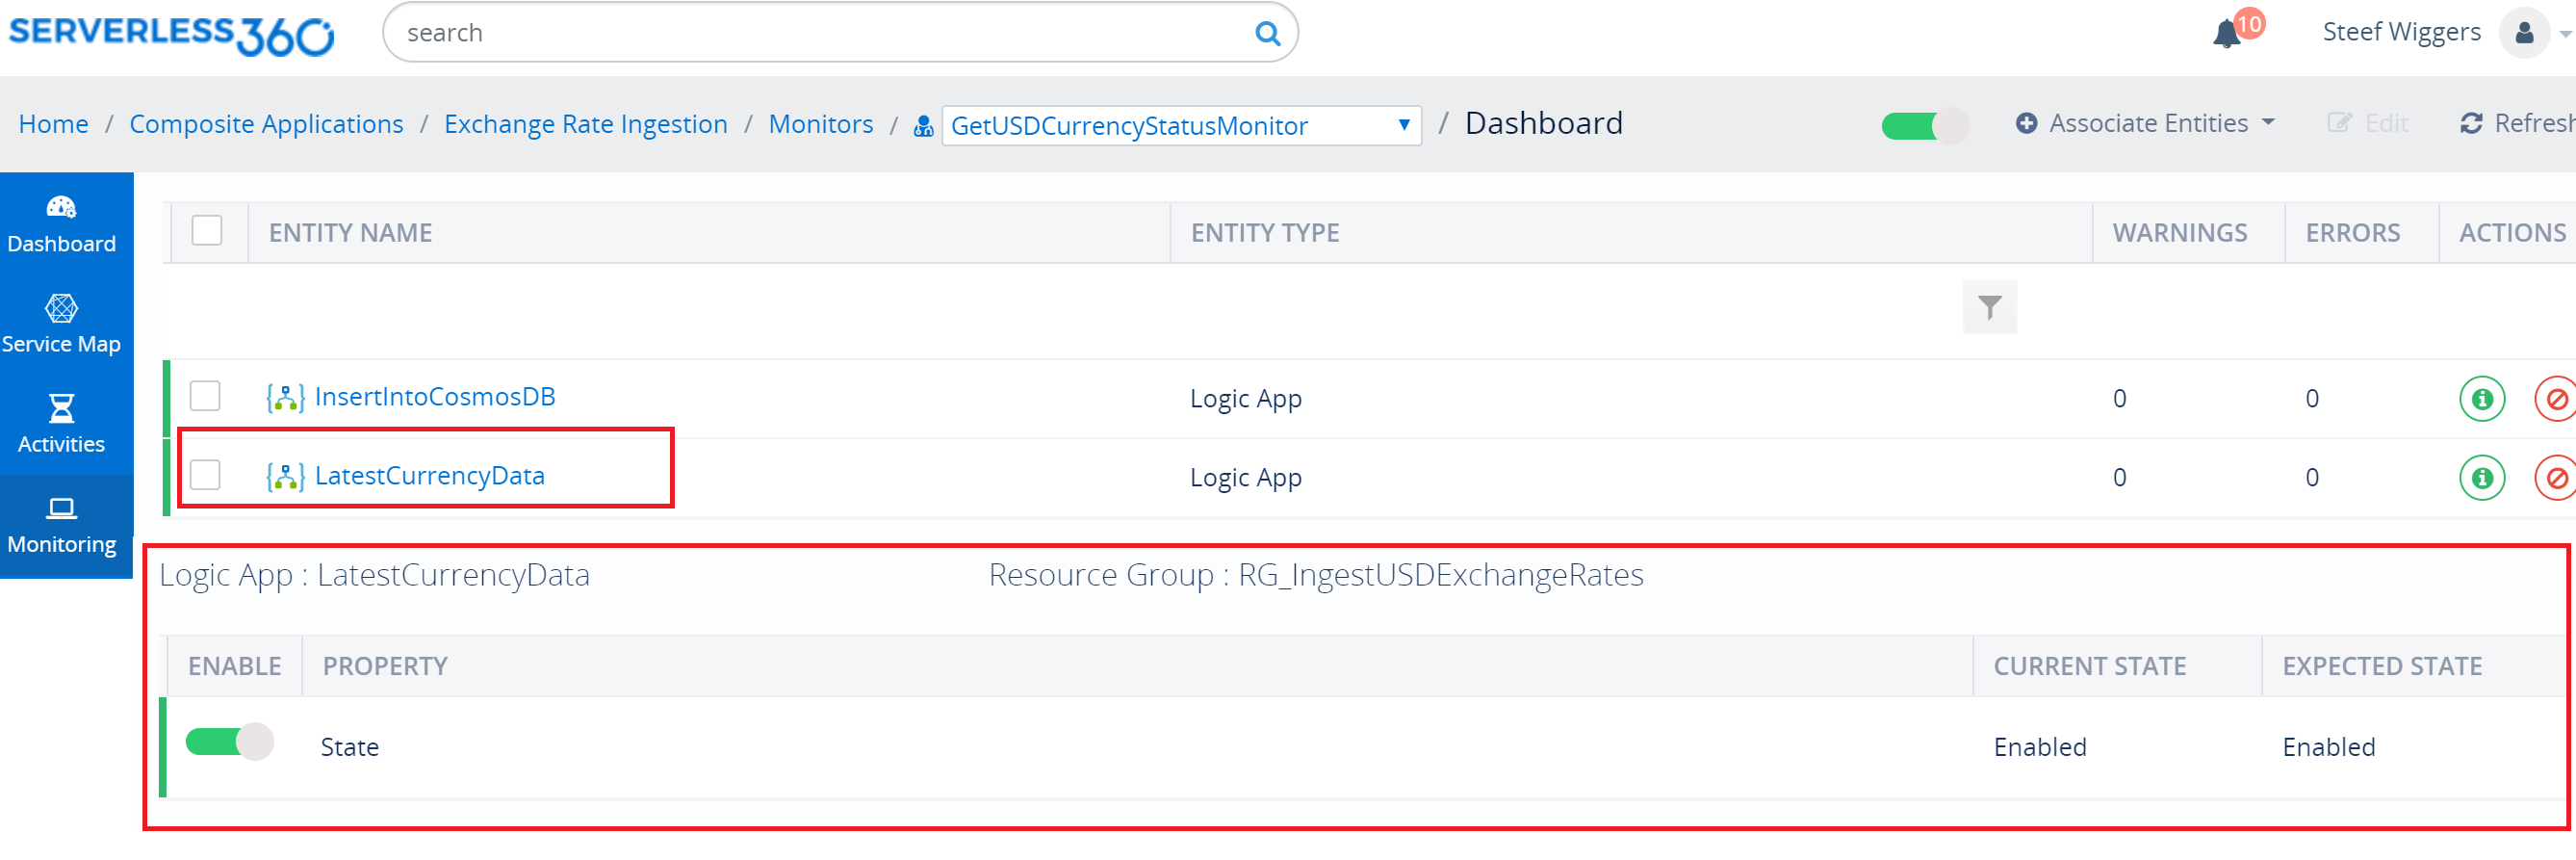
Status Monitor – health check report on all entities in the business application. We can set a status monitor for each of the entities in our solution (Logic Apps, Queue, and Function App) – in our scenario; we create a status monitor for both the Logic Apps.
Data Monitor – monitor the entities in various perspectives like availability, efficiency, performance, reliability, and so on. We could set up a data monitor to observe the runs and actions as a result of recurrence (schedule) if necessary.
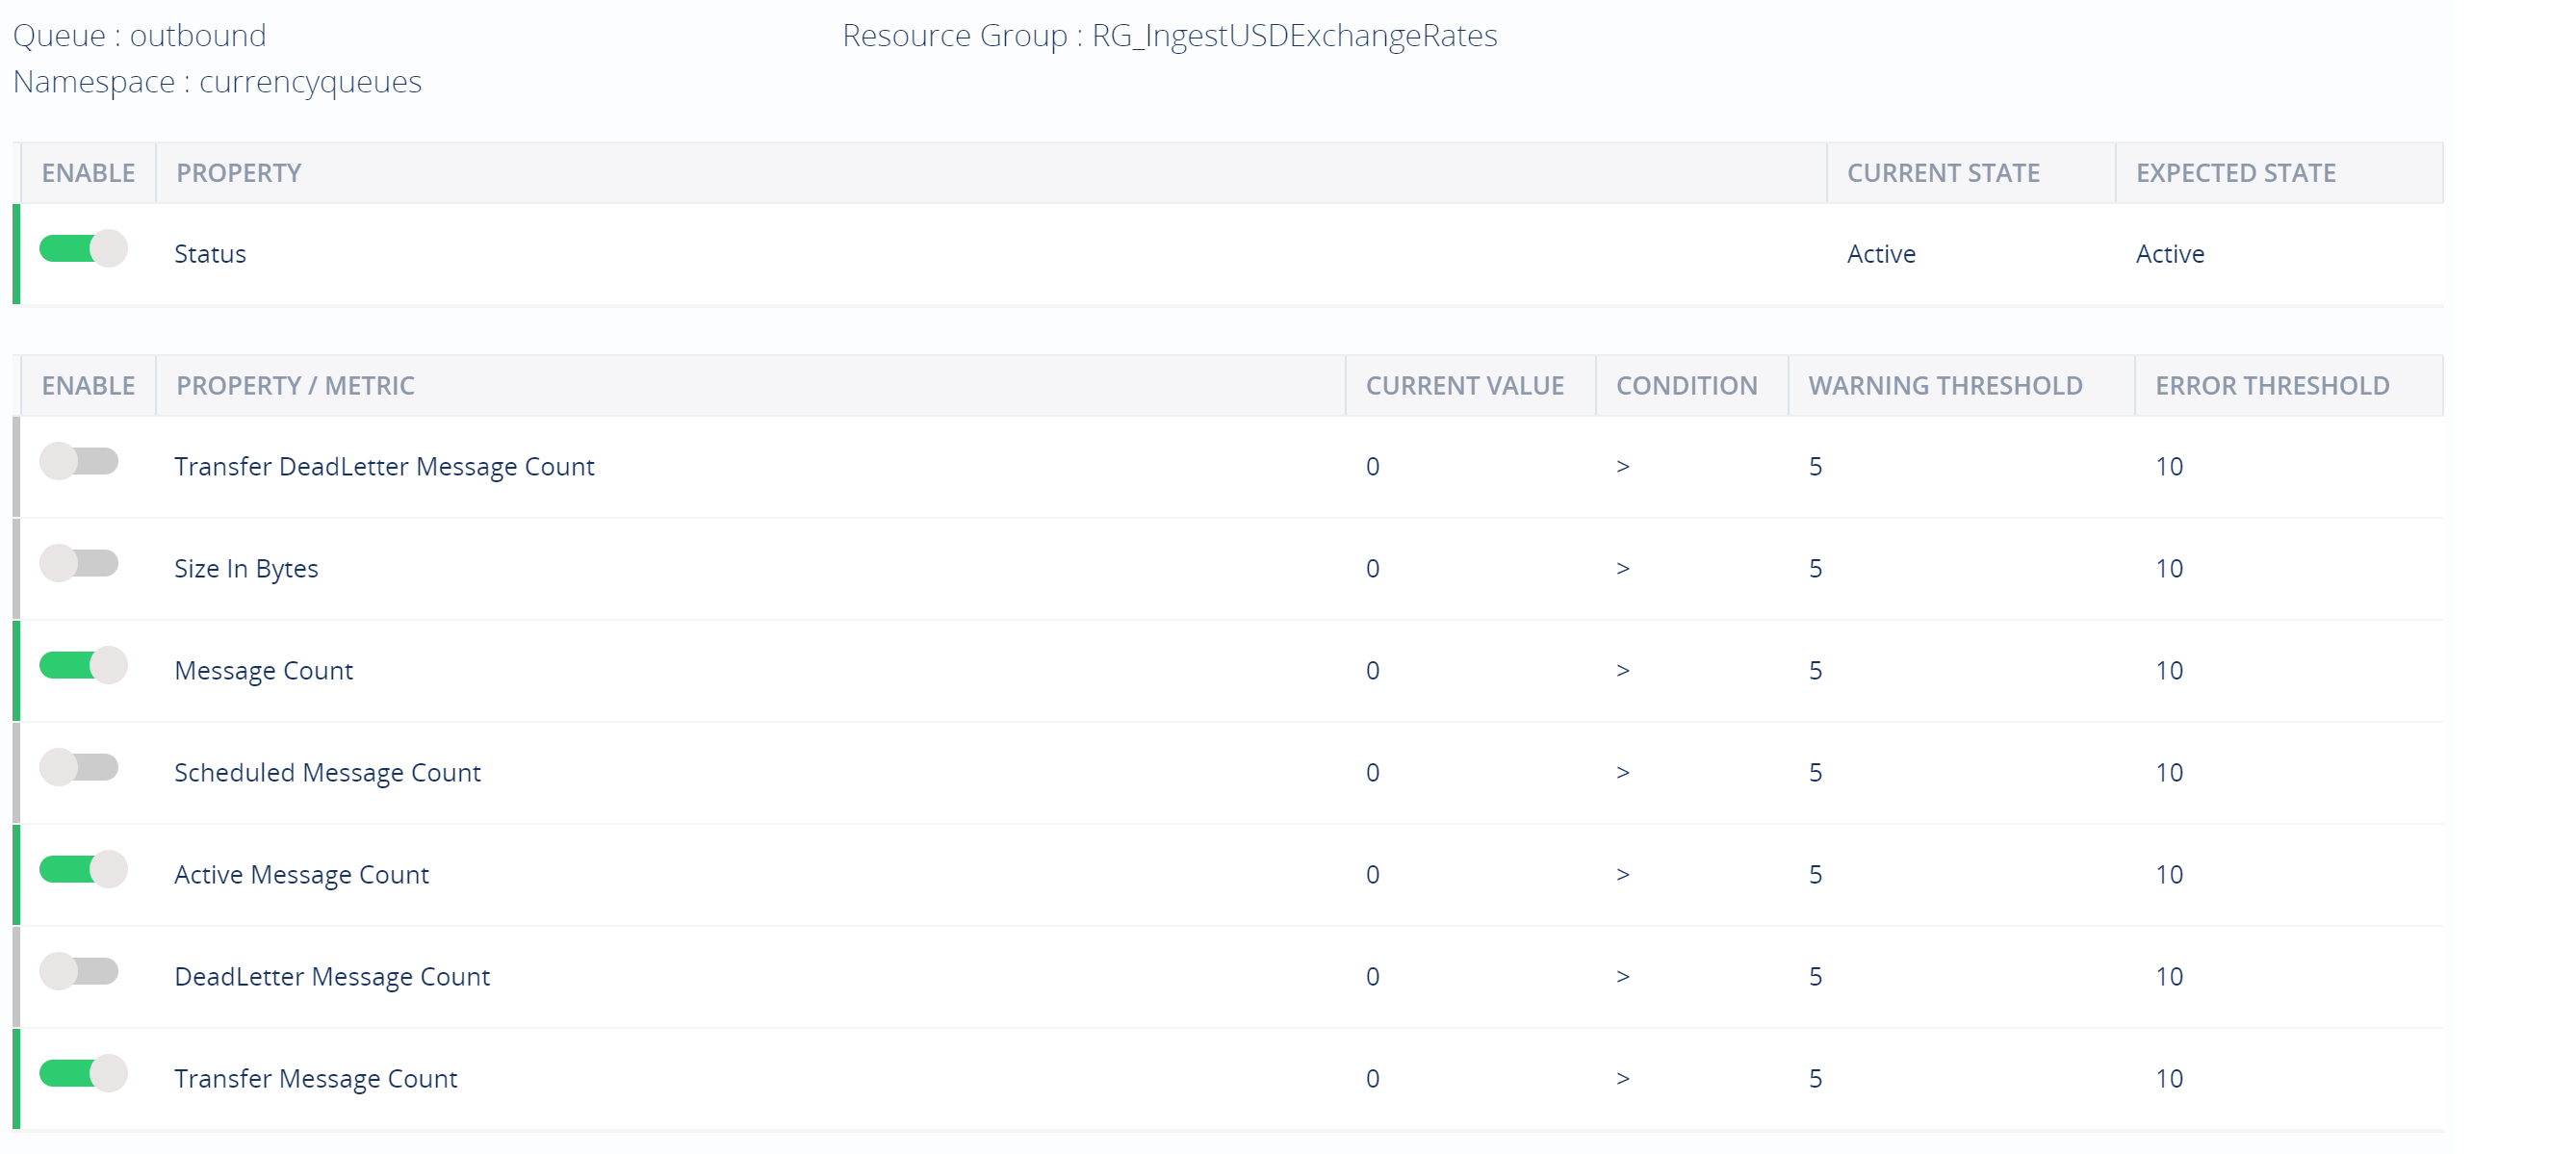
Threshold Monitor – have alerts; even if one of the entities violates the configuration beyond the threshold time limit. We set up a threshold monitor for queue in our solution.
Watch Monitor – detect a failure in a Logic App, Function App or API. We set up watch monitors for the Logic Apps, and Function App in our solution.
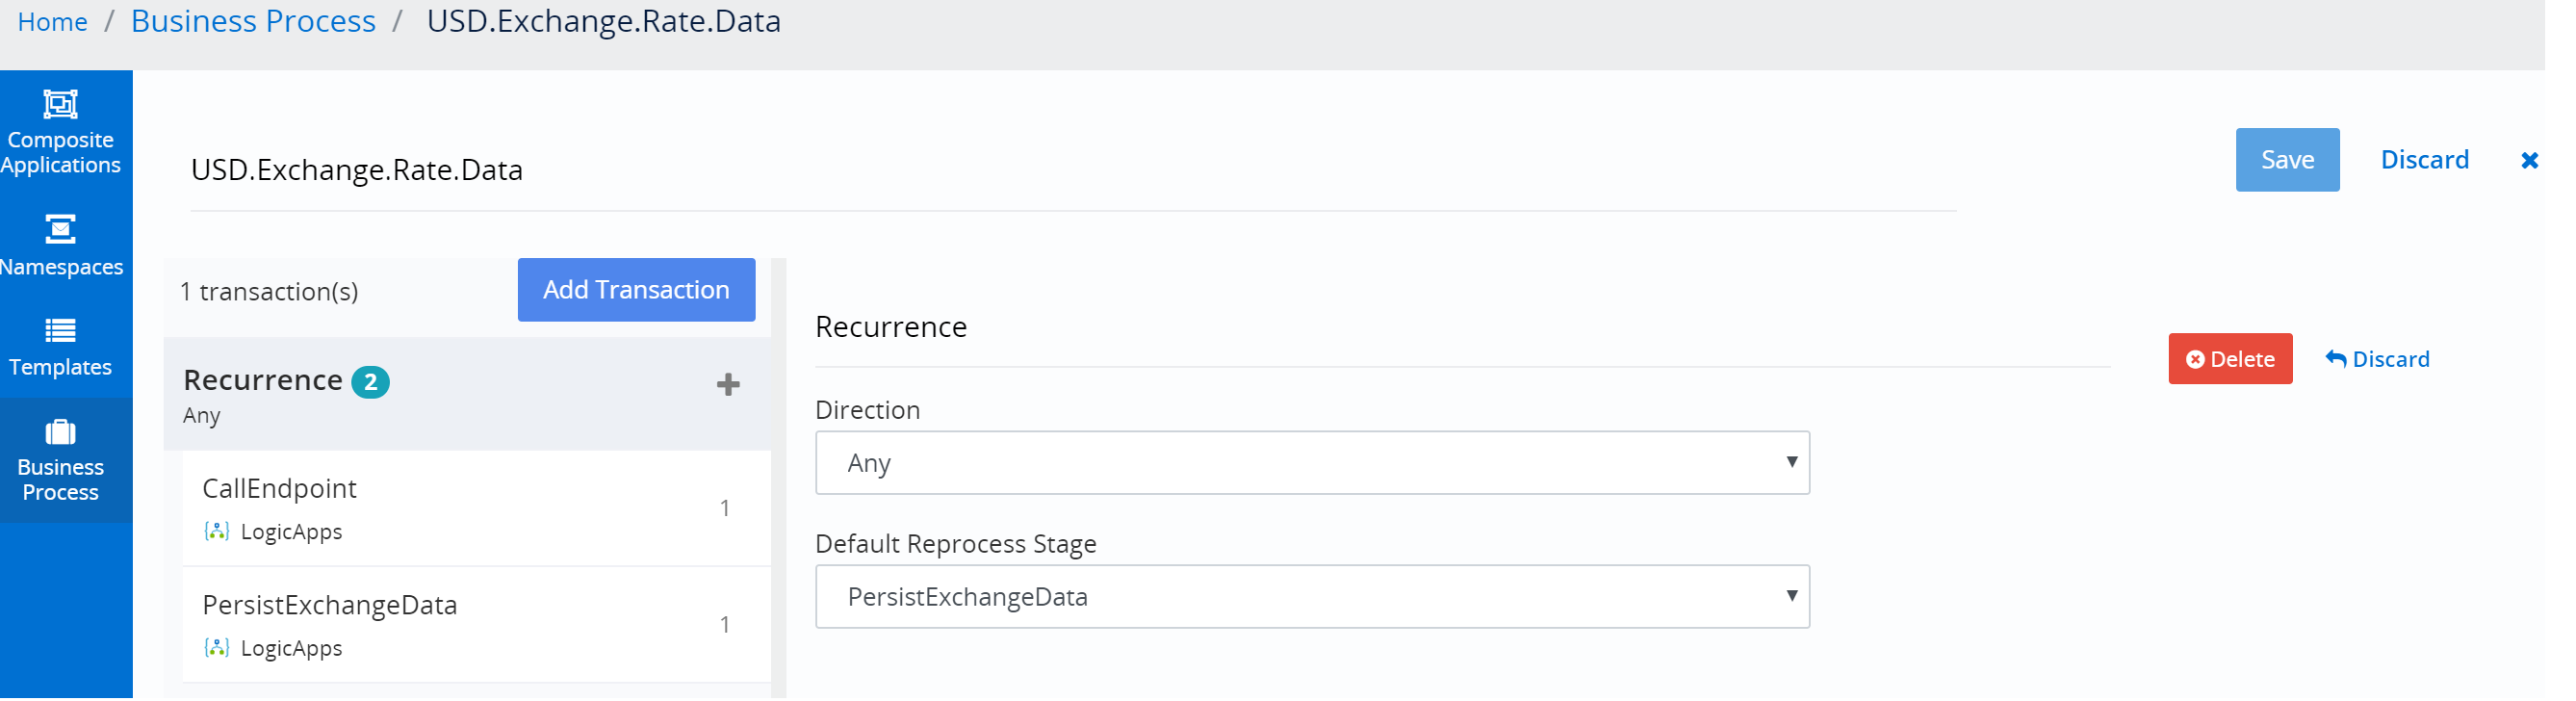
Next, to the monitors, Turbo360 also enables us to set up an end-to-end tracking feature. Depending on the number of business processes a composite application might have, you can monitor each of them. For instance, in our scenario, we can set up end-to-end tracking by defining a business process that includes a transaction with two stages: one stage for ingestion of data by the first Logic App and the second stage for inserting the data into a Cosmos DB document collection.
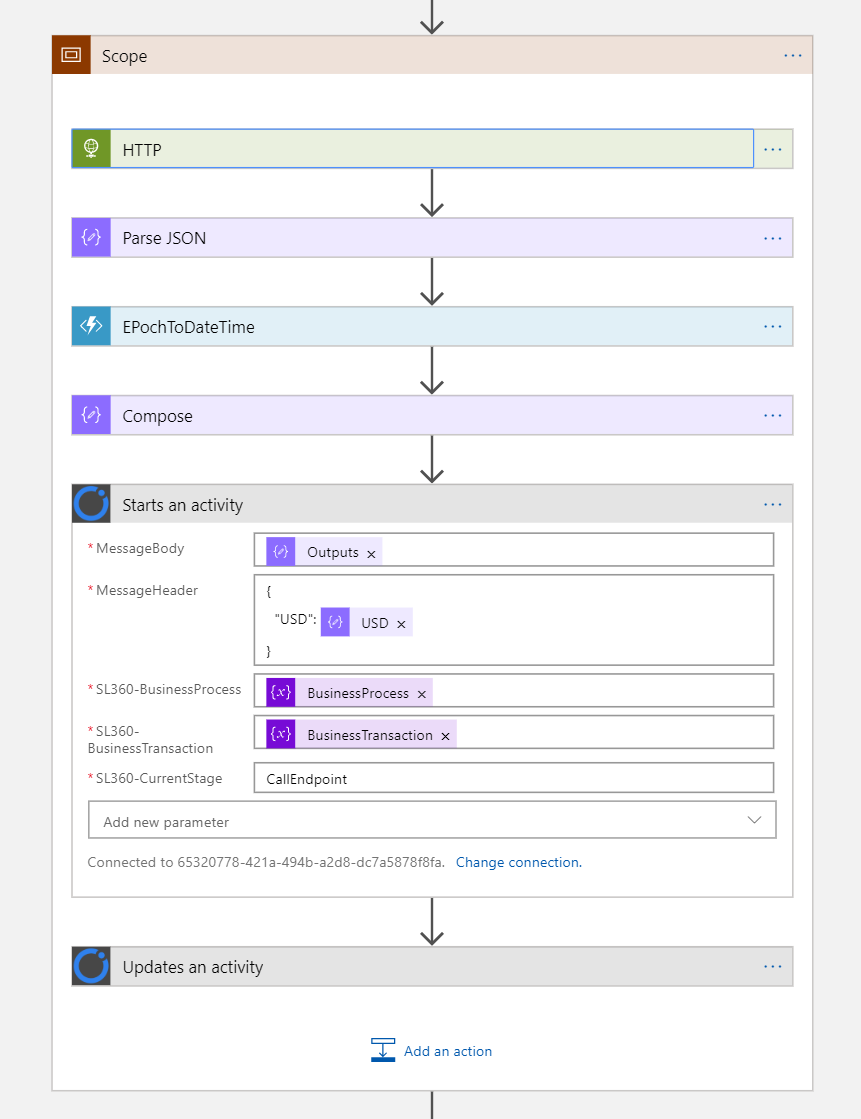
After defining the business process in the Turbo360 portal, we instrumented our Logic Apps with the BAM connector. This connector is available on GitHub, and you need to deploy into the Azure subscription for cloud-native integration solutions. Next, step is to authenticate the connector before you can use it. Finally, we use the connectors in our two Logic Apps to representing the stages in our business process.
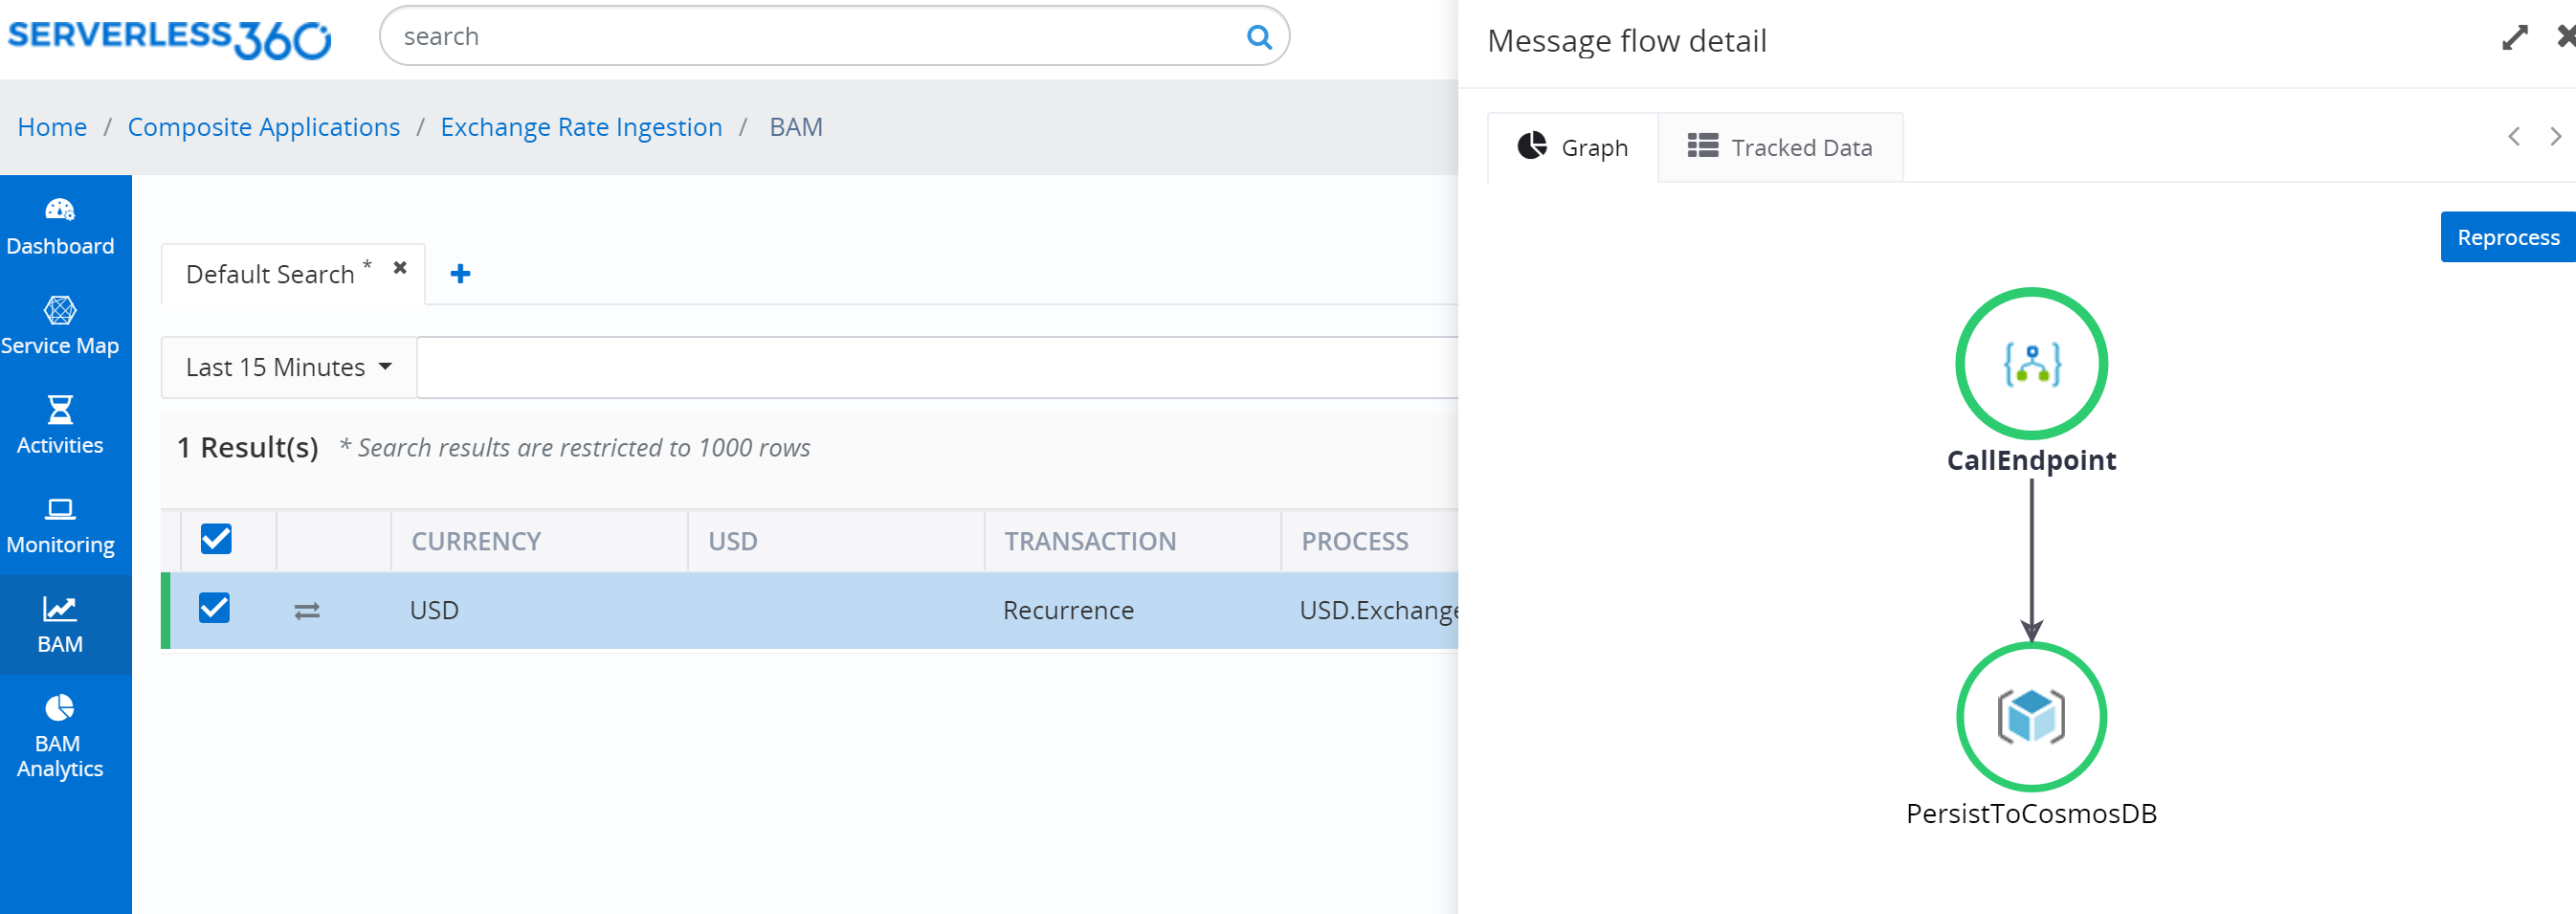
Once the process runs, you can observe in the composite application under BAM the tracking of the process, as shown below.
The end-to-end tracking in Turbo360 provides several features to further dive into your business processes:
- Search – allows you to search for transactions by building queries on tracked properties and status to find the required transaction.
- Visualize – you can visualize your business transactions in a graphical representation with all necessary details at every stage.
- Reprocess – you can reprocess a transaction if it fails. In our scenario, when persisting to Cosmos DB collection fails, we can reprocess it by offering the payload from the first Logic App again to the Service Bus.
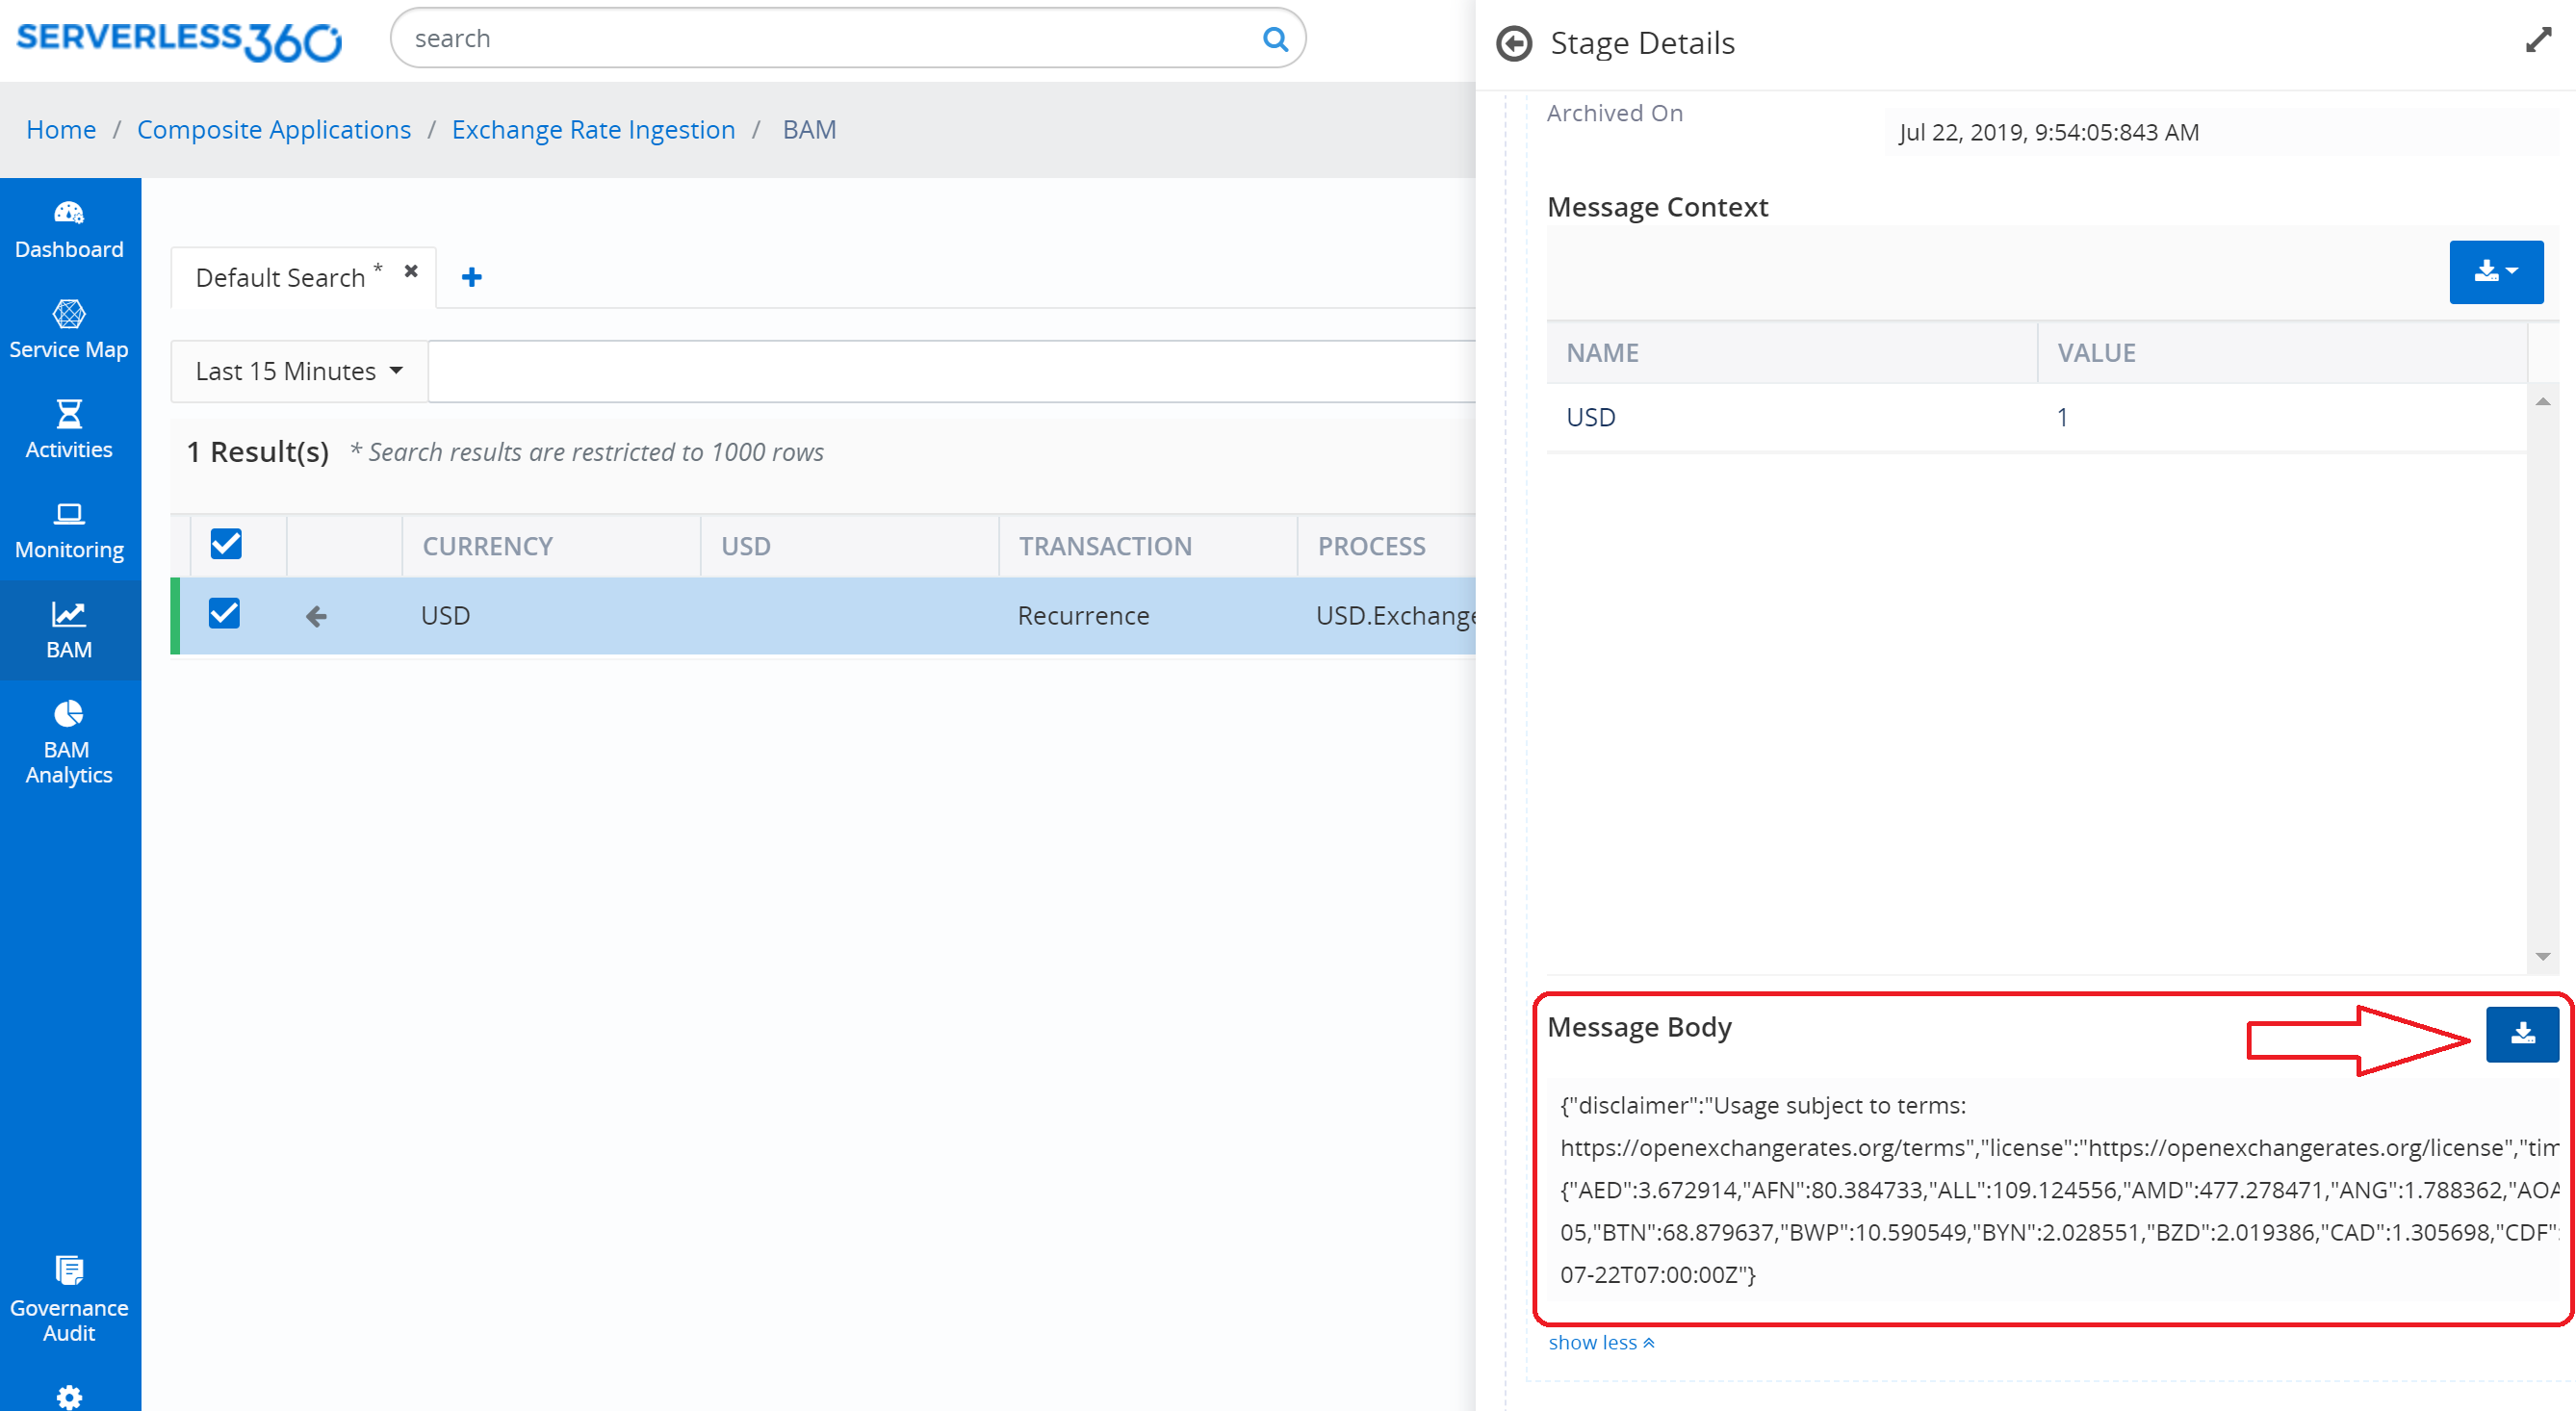
- Download – you can download the archived messages directly from the Turbo360 portal.
Lastly, similar to Azure Turbo360 allows to set up alerts to notify support people to take action. With the watch monitor, for instance, you can specify the frequency it needs to check the Logic App run history when it spots a failed run it would send a notification to the communication channel of choice. By default, you the Email channel, however, in the settings of the Turbo360 portal you can select other channels such as PagerDuty, Slack, and Microsoft Teams. Hence, you have various options to send notifications.
Note that Turbo360 and some Azure Monitoring services like Application Insight, Azure Monitor and Service Bus Explorer have some overlap. For a more detailed comparison, see the following pages on Turbo360:
Wrap up
Having a monitoring solution as a single pane of glass for your cloud-native integrations are challenging. Azure offers various monitoring services, which provides access to metrics, logs, and set up alerts. Furthermore, you can compose a dashboard in the portal to access them. However, it doesn’t provide you with a direct overview of your integrations and requires support people with a vast knowledge of the services and appropriate access to the Azure Portal.
With an off-the-shelf product like Turbo360, you can benefit from having a centralized overview of your integrations, and support engineers do not have to have access directly to the Azure Portal. Moreover, with Turbo360 you can give 1st tier support people a tool to perform the necessary actions or ability to escalate to 2nd of 3rd tier support people with a better understanding of the inner mechanics on Azure and access to the portal.
In this blog post, we scratched the surface of the capabilities of both the monitoring capabilities with Azure Services and Turbo360. The goal in this blog post is to find an appropriate answer when it comes to providing a centralized overview for support people. With Azure Monitoring services, it is a bit more challenging than with Turbo360 product – yet in general, each has its strengths and weaknesses.
We hope that with this blog post provided you with some insights into the challenge of having a centralized view or single pane of glass for your cloud-native integration solutions. From our viewpoint, it is possible for integrations, however, if you would want to include monitoring for network, SLA’s, and so on it should be clear that this is not possible with any service in Azure or third-party product.