Many organizations migrate their workloads to the cloud or begin leveraging what the cloud offers. However, to keep their businesses up and running during this process, organizations still require integrating their systems in the cloud, like Dynamics365, Salesforce, and ServiceNow, with Azure Integration Services (AIS) and potentially on-premises. One crucial aspect of such integrations is keeping them healthy and available, which requires monitoring and diagnostics. So, this blog will help you compare various Azure monitoring tools and determine the top one for your business.
How to choose the right Azure Monitoring Tool for your business?
Traditional monitoring tools were mainly built for monolith applications and not for highly integrated and distributed Azure applications. Hence, the dynamic nature of complex Azure integration requires a different approach to maintain their health status and ensure availability.
Here are some aspects that you should consider while choosing an Azure monitoring tool for your business;
- Proactive Azure resource monitoring for services from various subscriptions, tenants & regions.
- Integration with native monitoring tools to extract data from them for better reporting and troubleshooting.
- Providing assistance to rectify issues before customers report them.
- Alerting if the application is not performing as expected.
- Support for Azure resource dependency mapping.
- Automation and self-healing capabilities to reduce the mean-time-to-resolution.
- Integration with various notification channels for sending alerts.
- Support for governance and auditing capabilities to know who does what
- The option to sign up for a free trial or demo session, which aids in evaluating the tool before making a purchase decision.
What are the Top 5 Azure Monitoring Tools right now?
Various cloud monitoring and management tools provide features and benefits for monitoring integrations, such as Azure Monitor, Turbo360, Dynatrace, Datadog, and New Relic. This article takes a closer look at these tools and highlights some of their key features and benefits.
Each of these tools has its strengths and weaknesses, and selecting the best one depends on the specific needs and requirements of the organization. Ultimately, we will conclude which tools best suit integration solutions built with AIS.
1. Azure Monitor
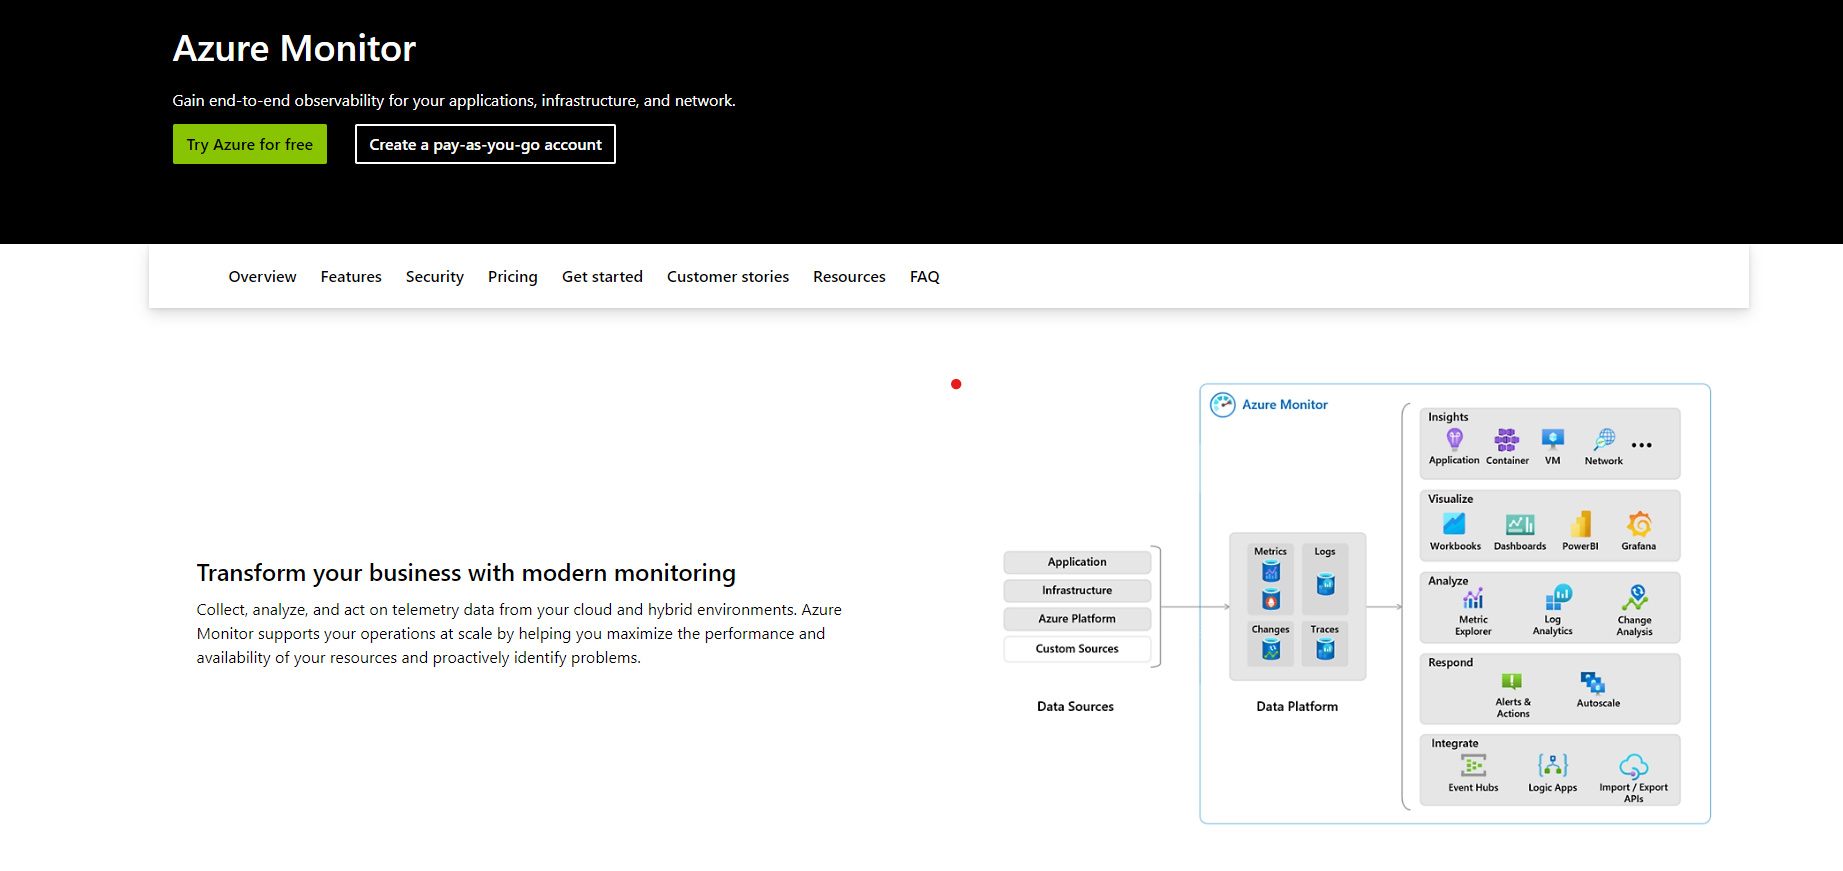
It is a comprehensive Azure monitoring tool for the Azure cloud platform. It provides a unified view of your application and infrastructure health, with features such as log analytics, metrics, and alerts. Azure Monitor also integrates with other Azure services, including Azure Functions and Azure App Service, allowing for deeper insights and analysis. Get to know the pros and cons of Azure Monitor.
Pros
-
- Easily accessible: Azure Monitor is built into the Azure portal, eliminating the need to use a different third-party tool for monitoring.
- Alerting: It allows you to set up alerts based on specific metrics and conditions.
- Monitoring multiple services: Azure Monitor supports monitoring various Azure resources and services, including virtual machines, databases, and applications.
- Scalability: Azure Monitor is scalable, allowing you to monitor large-scale environments easily.
Cons
-
- Siloed monitoring on Azure resources: You will have to set up monitoring alerting for every resource involved in your application (No application-level monitoring).
- Hard to attain message tracking: Requires a lot of instrumentation to partially attain end-to-end message tracking using App Insights.
- Complexity: Azure Monitor can be complex and challenging to configure, especially for users new to Azure or cloud monitoring in general.
- Cost: Azure Monitor can be expensive, especially if you monitor many resources or generate a high volume of data.
- Limited monitoring of non-Azure resources: Azure Monitor is primarily designed for monitoring Azure resources and may not provide comprehensive monitoring for non-Azure resources.
- Limited functionality for some resources: Azure Monitor may not provide all the functionality you need to monitor some resources, which may require you to use additional tools or services.
Deciding between Azure Monitor and Turbo360? Check out our comparison: Azure Monitor vs Turbo360
2. Turbo360 (Serverless360)
Turbo360 (Formerly Serverless360) is one of the top-rated Azure monitoring tool for complex integrations built on Azure. The platform offers end-to-end visibility, unified Azure Monitoring from an application context and includes features such as event triggers, alerting, and diagnostics. As an advantage, you can auto-document your entire Azure Infrastructure and have complete control over the cost using Turbo360.
It also supports enabling role-based access control and governance, making it ideal for enterprise-level deployments.
How Turbo360 differs from native-Azure monitoring tools?
- Holistic view: Visualize the Azure services across tenants and subscriptions from an application context.
- Consolidated error reporting: It avoids sending multiple alerts for siloed services and instead generates and sends one consolidated report.
- Azure resource dependency mapping: Real-time visualization of dependencies between Azure services in an application.
- End-to-end visibility: Track how the message/request flows across your Azure/hybrid integrations.
- Root-cause analysis: Get to the bottom of any critical failures with no dependency on Azure experts and proactively resolve issues before they impact your users.
- Pre-defined monitoring templates: Set up Azure monitoring on multiple metrics within minutes and get alerted on threshold violations.
- Detect issues faster: Customizable dashboards with actionable insights and KPIs to pinpoint any deviation in the application performance.
- Enhanced security: It supports integrating with Azure Active Directory and offers advanced security features such as access control and threat detection.
- Avoid juggling between multiple tools: It simplifies the management of Azure applications by providing a single platform to monitor, track and troubleshoot critical failures.
- Automation: Turbo360 offers an advanced operational toolset to automate mundane tasks.
Cons
- It is primarily designed to work with Azure services and may not provide comprehensive integration with non-Azure services.
- Has a steep learning curve for beginners.
Get hands-on experience with a 15-day free trial.
3. Dynatrace
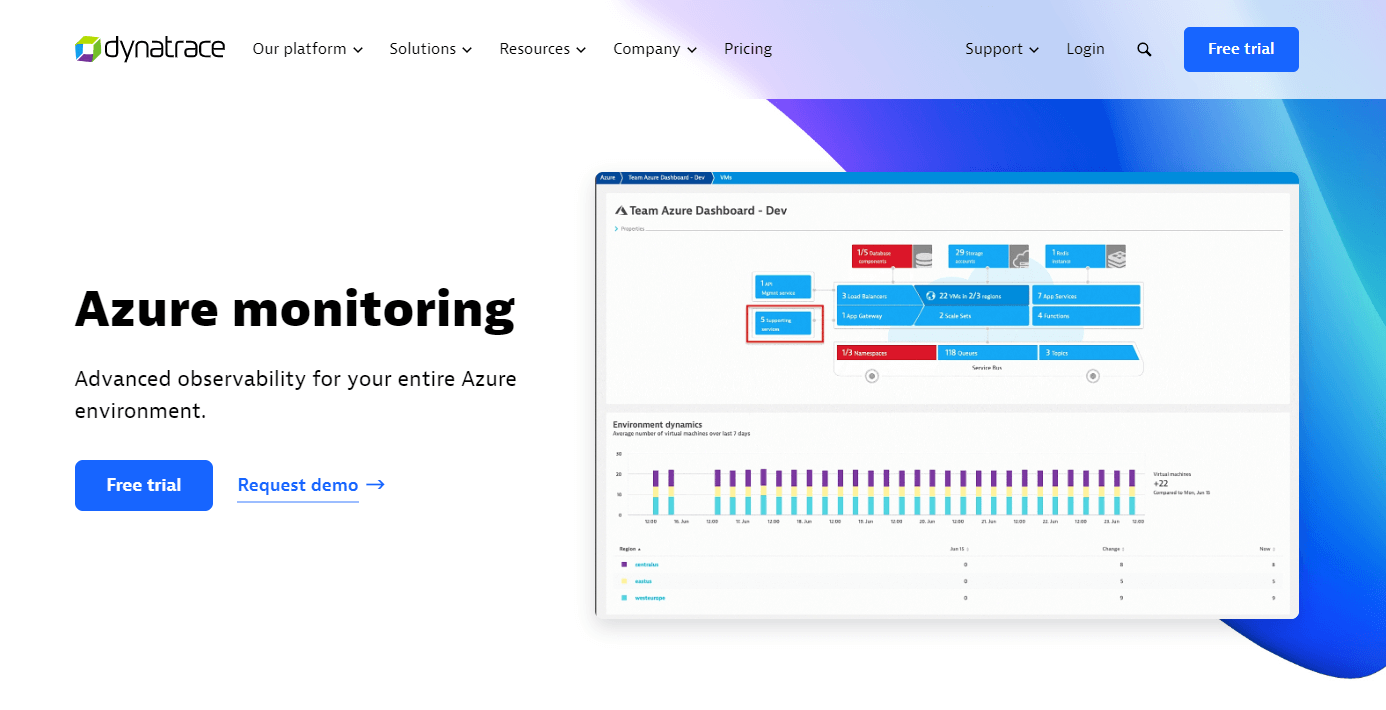
Dynatrace is a cloud monitoring and management tool that provides real-time insights into your applications and infrastructure. It offers a range of features, including application performance monitoring (APM), infrastructure monitoring, and user experience monitoring. Dynatrace also provides AI-powered root cause analysis, which can help to identify and resolve issues.
Pros
- Multi-cloud environments: It provides real-time insights into the performance of applications built on top of multi-cloud services.
- Root cause analysis: It uses Artificial Intelligence (AI) and Machine Learning (ML) to automatically detect and analyze issues.
- Reporting dashboards: Easy-to-use custom dashboards to visualize business-critical data.
- Integration with other tools: It integrates with a wide range of different tools and services, such as Jenkins, Git, and AWS, which makes it easier to incorporate them into your existing workflows.
Cons
- Expensive with high volumes of data: Dynatrace can be expensive, especially if you monitor many applications or generate a high volume of data.
- Limited customization: Dynatrace may not provide all the customization options you need to tailor it to your specific application requirements.
- Limited monitoring of non-web applications: Dynatrace is primarily designed for monitoring web applications and may not provide comprehensive monitoring for non-web applications.
To gain a more profound perspective, evaluate Dynatrace vs Turbo360.
4. Datadog
Datadog is a cloud monitoring and analytics platform that offers real-time monitoring and insights across your entire stack. It offers customizable dashboards and alerts, making it ideal for teams who need to stay on top of their applications and infrastructure.
Pros
- Unified platform: Datadog offers a unified platform that can handle infrastructure monitoring, application performance monitoring, log management, security monitoring, network monitoring, synthetic monitoring, and real user monitoring.
- Extensive integration: Datadog supports integrating with various cloud services and tools.
- Ease of deployment: Datadog has a simple and fast installation and configuration process.
- Scalability: Datadog like Dynatrace is highly scalable and can easily monitor large-scale environments.
Cons
- Complexity: Datadog can be complex and challenging to configure, especially for users who are new to cloud monitoring or have not before used similar tools.
- Expensive: Datadog can be expensive for log analytics and data retention.
- Limited monitoring of non-cloud resources: Datadog is primarily designed for monitoring cloud resources and may not provide comprehensive monitoring for non-cloud resources.
5. New Relic
New Relic is a cloud monitoring and management tool that provides insights into your applications and infrastructure’s performance and health. It provides real-time data to build charts and pinpoint critical issues with minimal effort.
Pros
- Real-time monitoring: It supports continuous monitoring of your Azure applications to avoid unexpected performance issues.
- Customizable dashboards: New Relic allows you to create customizable dashboards that display the metrics and data that are most important to you.
- Integration with other tools: New Relic integrates with a wide range of different tools and services, such as AWS, Kubernetes, and Docker, which makes it easier to incorporate them into your existing workflows.
- Scalability: Like Datadog and Dynatrace, New Relic is highly scalable and can easily monitor large-scale environments.
Cons
- High complexity: New Relic can be complex and challenging to configure, especially for users new to cloud monitoring or who have not before used similar tools.
- Compatibility: It can have compatibility issues with some frameworks and languages.
- Limited customization: It may not provide all the customization options you need to tailor it to your specific application requirements.
Conclusion
These tools may fit your organization well depending on your specific needs and requirements. Therefore, it’s essential to evaluate the features and benefits of each tool carefully before deciding.
Azure Monitor and Turbo360 can be considered for monitoring integration solutions built on Azure. This may not be a surprise since both focus on Azure, while the other three provide integration with also other cloud platforms and applications.
Azure Monitor offers built-in integration with various Azure services and resources, enabling it to monitor siloed services like Azure Functions, Logic Apps, and API Management.
On the other hand, Turbo360 boasts advanced monitoring and alerting capabilities, customizable dashboards, and detailed reports. It also provides role-based access control, governance, and end-to-end visibility, monitoring, and management of siloed Azure services from an application perspective.
To conclude, Turbo360 turns out to be the top pick for unified monitoring on Azure services and end-to-end tracking across Azure/hybrid integrations that makes root cause analysis and troubleshooting faster.