Modern applications are increasingly built using containers and microservices packed with their dependencies and configurations. Kubernetes is open-source software for deploying and managing those containers at scale—and it is also the Greek word for helmsmen of a ship or pilot.
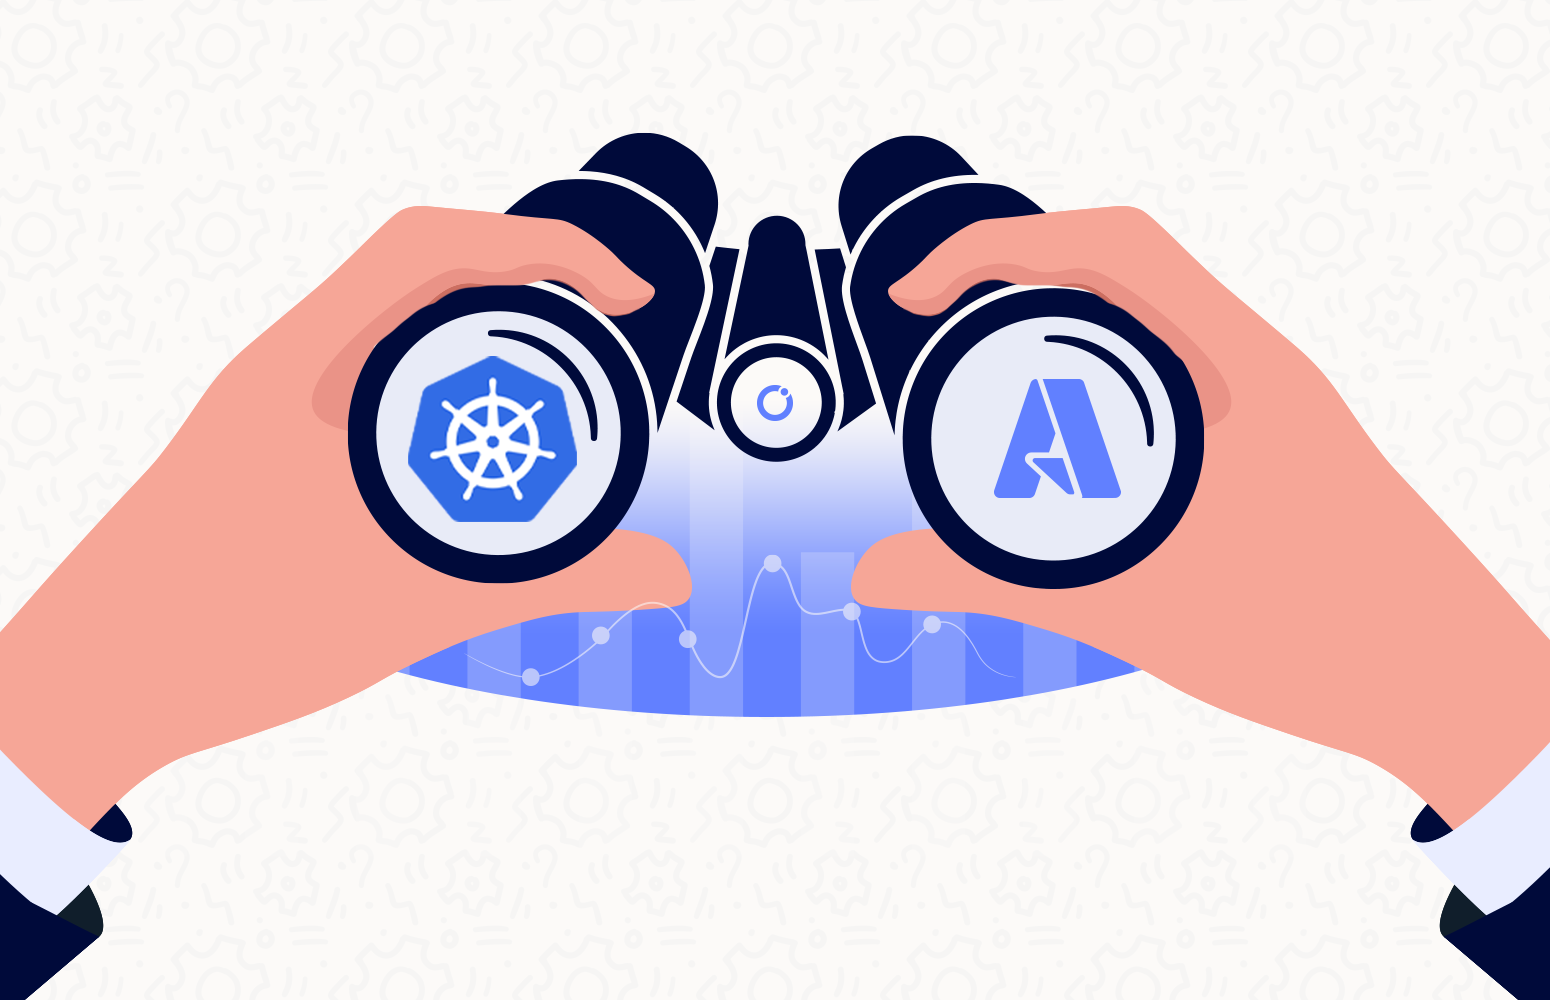
Monitoring the health and performance of your Azure Kubernetes Service (AKS) cluster is critical to ensure that your applications are up and running as expected. Let’s dig down to see how we can monitor Azure Kubernetes services and use Turbo360 for effective monitoring.
How do I monitor Azure Kubernetes?
AKS can be monitored using the Azure Monitor. Container monitoring can be enabled from the Azure portal when the AKS cluster is created. Kubernetes cluster monitoring is targeted explicitly at monitoring the resources the applications use in each cluster. These resources include CPU, memory, and storage. In addition, monitoring the Kubernetes cluster ensures you have up-to-date pod processes, and that pod containers aren’t repeatedly crashing and restarting. It also makes sure that there are sufficient nodes to run the pod processes.
Monitoring AKS resources can be performed in two ways
- Directly from AKS cluster
- Azure Monitor
Both ways mentioned above have similar options and display details about the health of the AKS applications.
The health (preview) feature in the Azure Monitor provides proactive health monitoring of the Kubernetes cluster to help identify and diagnose issues. It gives the ability to view the significant problems detected. Kubernetes cluster health is based on several monitoring scenarios organized by AKS infrastructure and nodes.
How do I monitor logs in Kubernetes?
Azure Monitor Logs collects data from the Kubernetes components and resources. These logs, generated from the nodes, pods, containerized applications, and Kubernetes control plane, can be viewed and analyzed on the Logs page. This page has a sophisticated query analyzer that lets users quickly analyze millions of records. This feature enables you to analyze your logs, configure alert rules, visualize your logs, and more.
Log Analytics helps in monitoring and querying the logs in Kubernetes. Once Azure Monitor is enabled for AKS, Log Analytics will be populated with the performance metrics, container logs, etc. Log Analytics comes with a pretty complex query language which helps a lot and makes it very simple to drill down into the data.
What Kubernetes metrics can be measured?
The monitoring can take place in two ways:
- Classic Monitoring
- Kubernetes specific monitoring
Classic monitoring includes monitoring the availability of the application, the resources that the application consumes, and the application’s health and performance. Monitoring the availability of the application ensures that the application is running in an excellent state.
Monitoring the application resources and consumption provides insights into the available resources in the cluster. As the application traffic increases, more resources are consumed, and the application performance will be affected when insufficient resources exist. The resources include CPU, memory, network, and storage.
Monitoring application health and performance provides insights into the overall perspective of the application’s health, speed, and performance. These insights include your application’s request rate and response time, the error rate, the network latency, and so on. It also provides the application bandwidth consumption, showing the sent and received data packets and the application’s bandwidth.
Kubernetes-specific monitoring includes monitoring the deployment status of the application, node health and performance, resource distribution to all pods, resource usage of nodes and pods, availability of pods, control plane, and node access of the Kubernetes cluster.
Kubernetes Cluster Monitoring
Azure’s built-in monitoring tool, Azure Monitor, can monitor the health and performance of the Kubernetes cluster. It provides features rich and variant features to effectively monitor the cluster, which includes
- Container insights
- Alerts
- Metrics
- Logs
- Diagnostic settings
- Advisor recommendations
- Workbooks
The container insights provide information and analytics about the cluster. It helps monitor the node resource utilization and container workloads and gives detailed information about active and failed pods.
On the Alerts page, the users can configure notifications for specific events in the cluster. For example, the alert can be configured to notify when the CPU consumption reaches 95%.
Kubernetes Pod Monitoring
Pods are the minor deployable units of computing that can be created and managed in Kubernetes. A Pod is a group of one or more containers with shared storage and network resources and a specification for how to run the containers. A Pod’s contents are always co-located, co-scheduled, and run in a shared context.
The Kubernetes pod metrics can be viewed using container insights. The CPU and memory utilization can be seen in the logs.
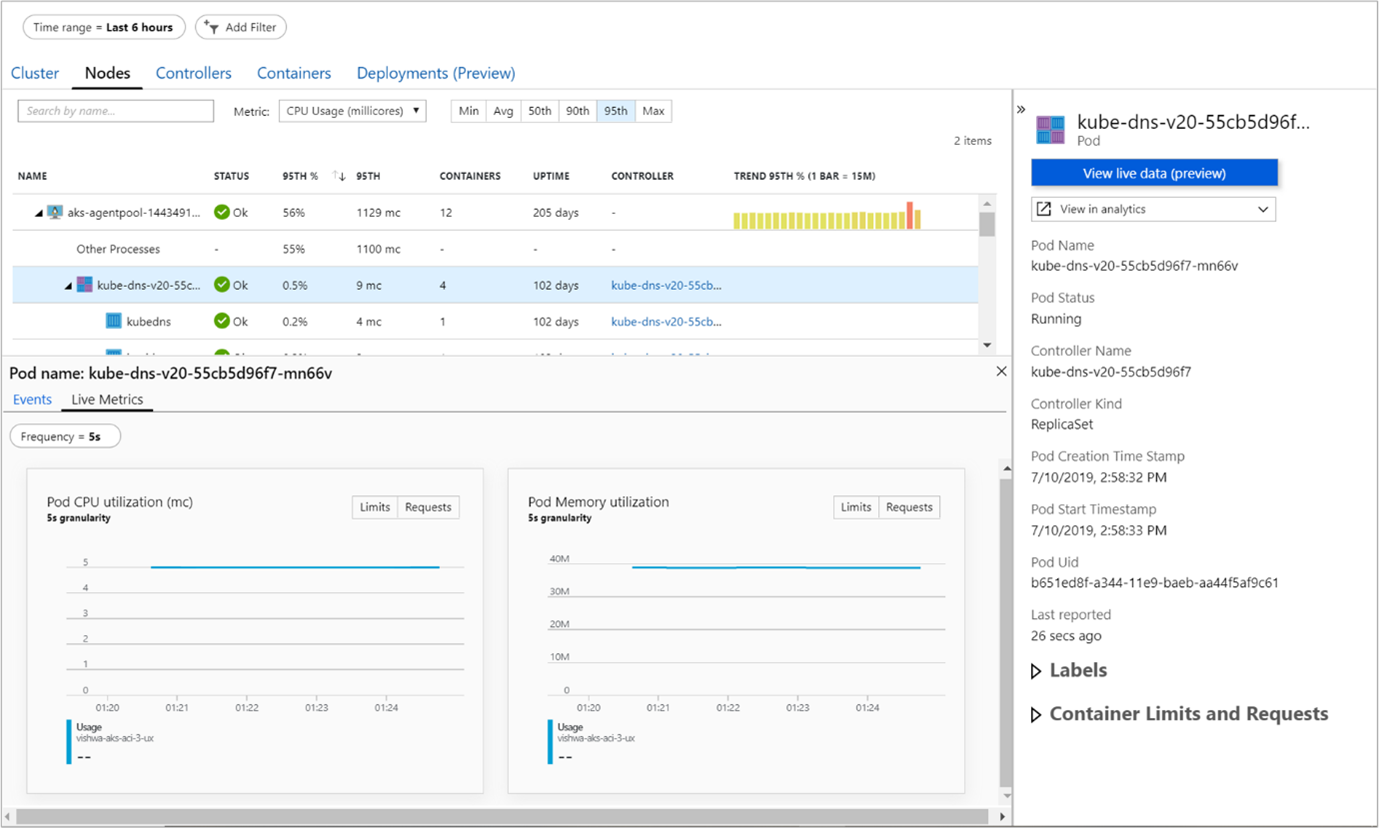
To check the pod’s status, run the kubectl get pod command and check the STATUS column. As seen below, in this case, all the pods are running. Also, the READY column states the pod is ready to accept user traffic.
# kubectl get pod
NAME READY STATUS RESTARTS AGE
 my-nginx-6b74b79f57-fldq6 1/1 Running 0 20s
 my-nginx-6b74b79f57-n67wp 1/1 Running 0 20s
my-nginx-6b74b79f57-r6pcq 1/1 Running 0 20s
The pods may also be in the following states:
- Pending or CrashLoopBackOff
- ImagePullBackOff or ErrImagePull
When the pod is pending, it cannot be scheduled on a node due to insufficient CPU or memory resources.
When your pod status is ImagePullBackOff or ErrImagePull, the pod could not run because it could not pull the image.
The kubectl describe command can be used to find the cause for the state of the pods.
Monitoring Azure Kubernetes Service(AKS) with Turbo360
Even though the Azure monitor gives insights about the health of the Kubernetes services, it would not be accessible to all the support team members. Hence Turbo360 provides the options to the users to monitor the Kubernetes services more effectively. The monitoring can be configured based on the different metrics for the AKS. The other exciting feature is that apart from sending alerts via emails, they can be triggered through different notification channels like Slack, PagerDuty, Teams, etc., supported in Turbo360.
Handling failures in Azure Kubernetes Service (AKS)
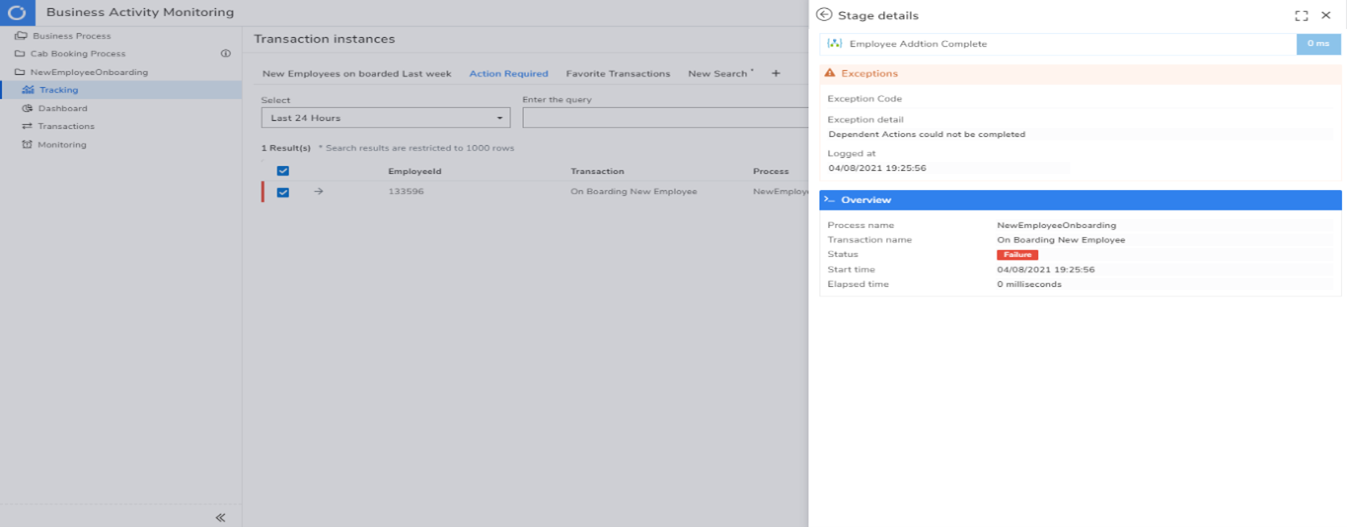
With the help of the monitoring profiles available in Turbo360, service failures can be identified and notified through alerts. The distributed tracing feature in Turbo360 BAM helps perform end-to-end message tracking and capture necessary data on business process flow across Azure resources and hybrid integrations. The failed transactions can be reprocessed. Visualizing the business transactions in graphical form and detailed data gives a complete overview of the business process and the status of the transactions.
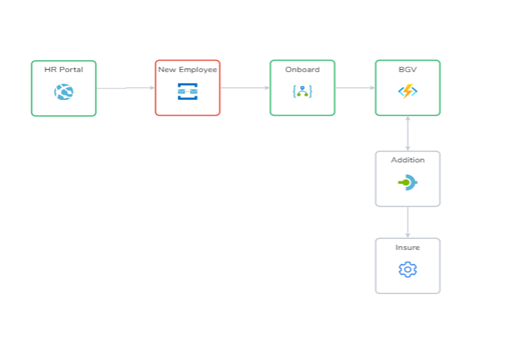
Quickly troubleshoot orchestration issues with Turbo360
Turbo360 BAM helps track the message flowing through various components in the business process. In this way, the business users and support operators get access to a convenient business workflow that they are familiar with, which abstracts the underlying complexities of the business components at work and provides them with self-service opportunities. If the user wants to find out why a particular transaction failed, they can go into the stage details and figure out the reason for the failure. If a failed transaction is detected, the business user can quickly reprocess the transaction to a successful state without relying on skilled Azure personnel, thereby reducing the overall cost of ownership.
Conclusion
With Turbo360, try monitoring the Kubernetes services and much more of the Azure components. The operational and monitoring capabilities included in Turbo360 give a shift-lift to your support team, which helps them operate efficiently with enterprise-grade Azure monitoring, tracing, remediation & governance in one platform. Happy monitoring! 😊