Azure Data Factory is a cloud-based data integration service provided by Microsoft Azure that enables users to create, schedule, and orchestrate data workflows to move and transform data from various sources to various destinations. It allows users to create and manage data pipelines that can extract data from various sources such as Azure Blob Storage, Azure SQL Database, Amazon S3, FTP, Hadoop, and more, and then transform and load the data into various destinations such as Azure Blob Storage, Azure SQL Database, Azure Data Lake Storage, and more.
What can be monitored in an Azure Data Factory?
Following are the troubleshooting and monitoring capabilities available in Azure Data Factory:
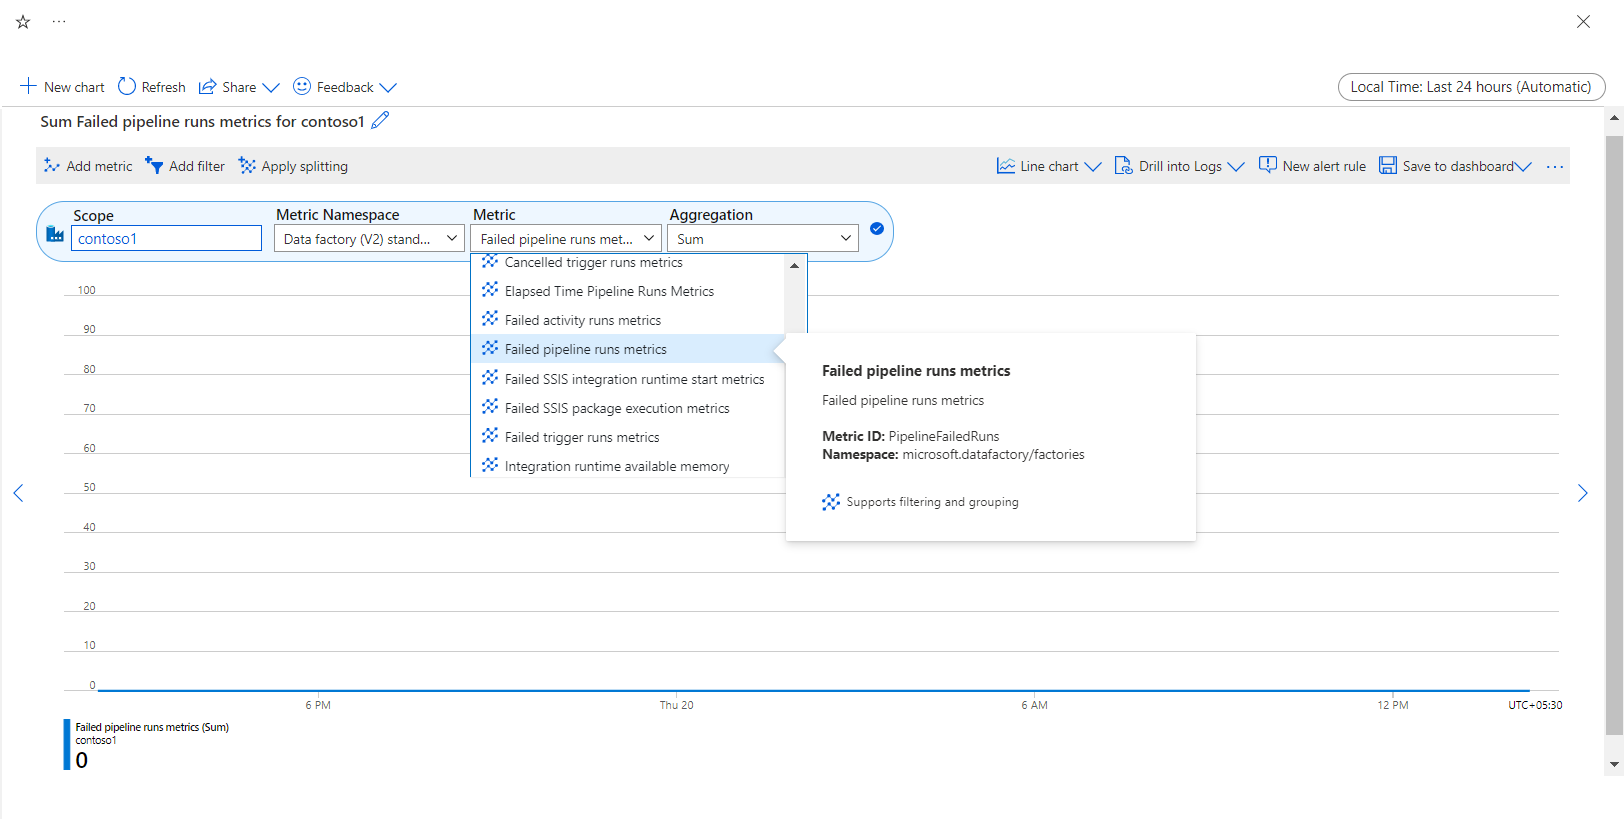
Metrics: Various metrics are available to analyze the performance, availability, and reliability of the factories, which can be visualized as charts and saved to dashboards.
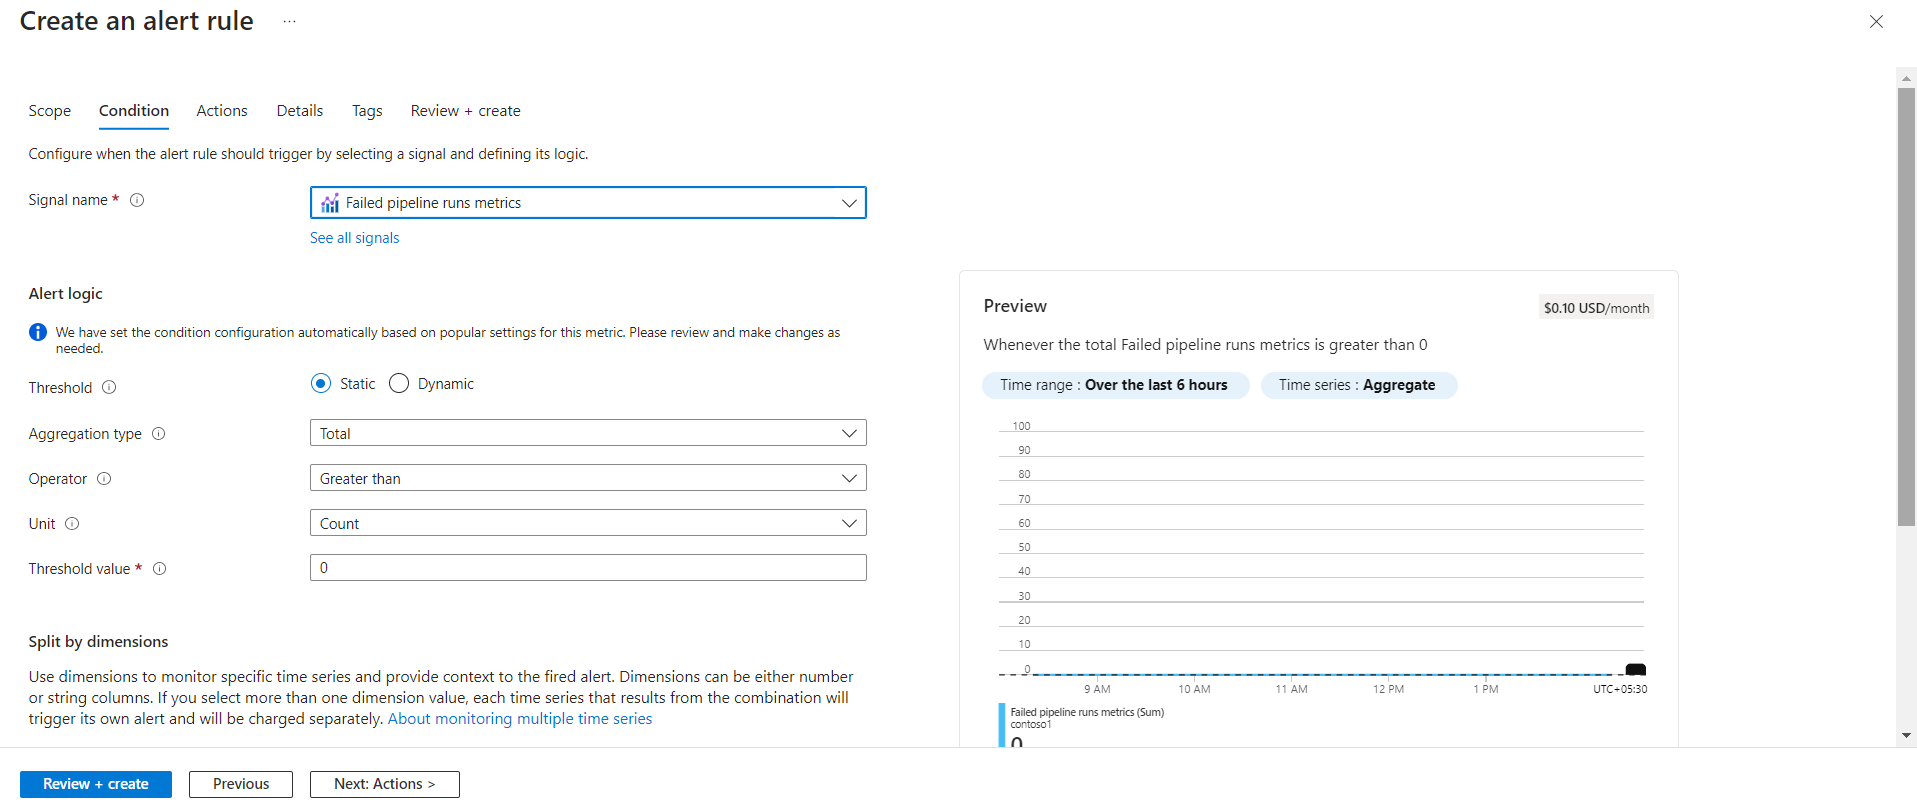
Alerts: Besides visualization, the metrics can be configured with threshold alerts. Whenever an alert condition is met, it will notify the channels configured.
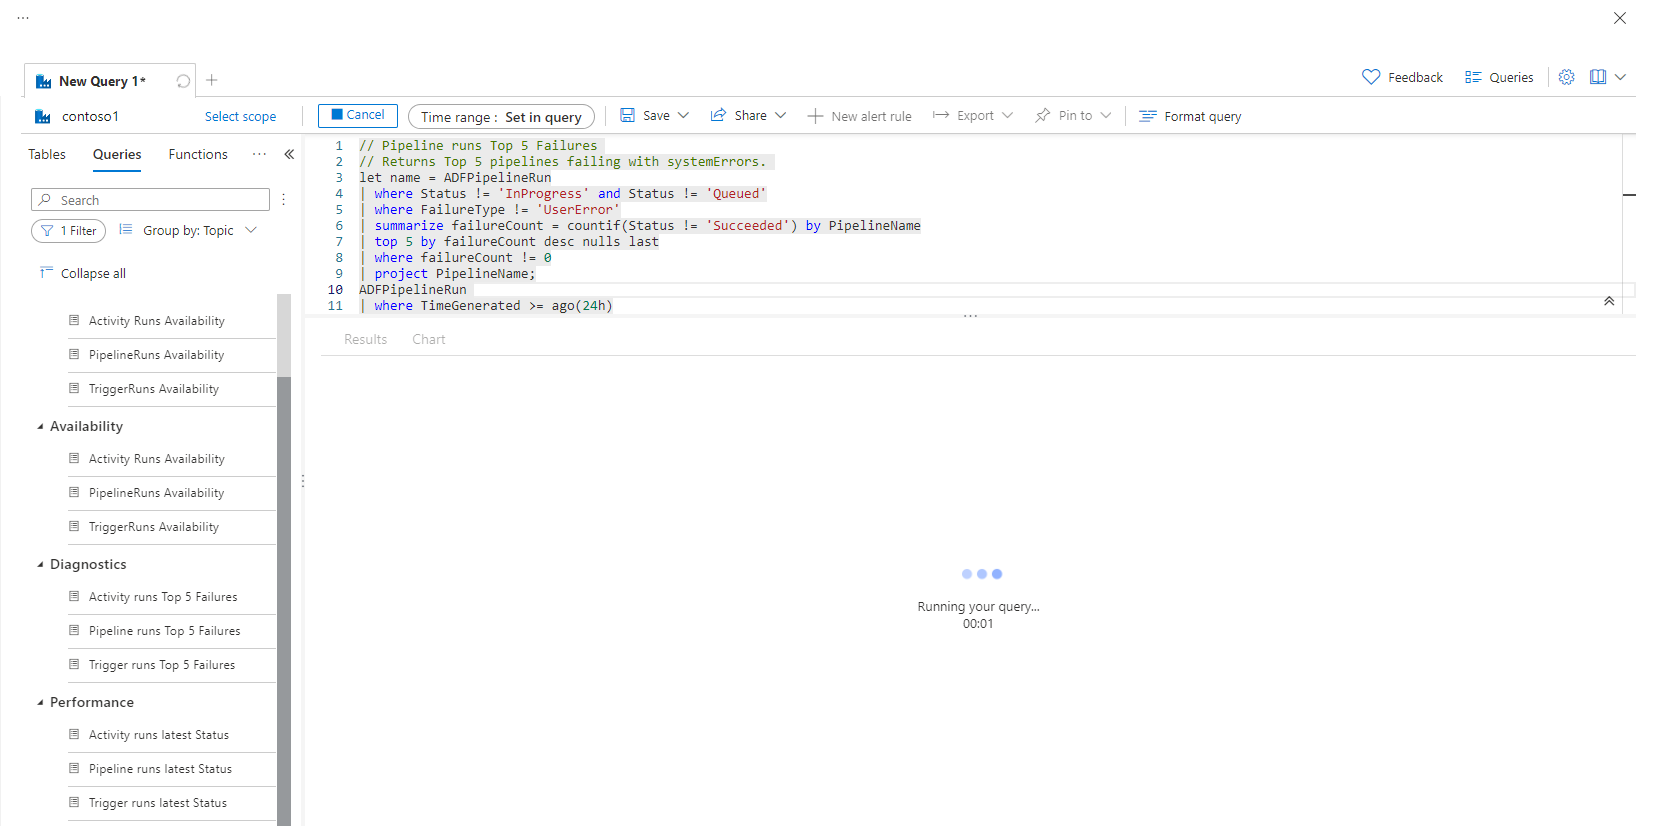
Logs: Logs related to Data Factories and the pipelines under them can be exported to multiple sources like Log analytics, event hubs, storage account, etc. Which can then be queried and monitored.
Analyzing Data Factory via Metrics in Azure
Azure Data Factory supports various metrics related to pipeline executions, data integration, and data processing. These metrics can help you identify issues, optimize performance, and ensure your pipelines meet their SLA.
For example, let’s say you have a pipeline that extracts data from an on-premises database and loads it into Azure Blob Storage. By analyzing the metrics, such as failed and succeeded pipeline run metrics, you can identify the trend of success and failures, optimize the pipeline and other supporting components, and ensure your data is processed efficiently.
Azure Data Factory monitoring and alerting
Data Factory supports integration to Azure Monitor, where you can set up alerts based on metrics and get notifications based on predefined conditions or thresholds. This lets you proactively detect and respond to pipeline and data integration workflow issues.
Here’s an example of how alert-based monitoring works in Azure Data Factory:
Suppose you have a pipeline that copies data from one Azure SQL database to another at regular intervals. You want to ensure that the pipeline runs successfully by copying the data, and if it fails, you want to be notified immediately so you can act. You can create an alert rule that sends a notification whenever the pipeline run fails. You will be notified according to the action group configured.
This enables you to proactively identify and address pipeline failures and guarantee that your data integration operations operate smoothly.
Data Factory monitoring using Logs
All the activities performed in Azure Data Factory are available as logs, and you can query them to understand the performance of the factory and its pipelines. Logs are available under categories like Alerts, Availability, Diagnostics, and Performance. You can create queries with different combinations and analyze the logs based on the requirements.
Here is an example of how log monitoring can be used in a Data Factory:
Let’s say you have multiple pipelines in Data Factory to serve multiple operations like copying new files from a File Share and loading it to an Azure SQL Database, copying data between 2 SQL databases, etc., and you want to know about the top 5 pipeline run failures during this process. You can investigate logs to collect the required details. These logs can provide valuable insights into the performance and behavior of the Factory, such as the top 5 pipeline run failures, top 5 trigger run failures, availability of activity runs, any error message, etc.
The above aspects of Azure Data Factory monitoring are excellent and appropriate for customers with limited Data Factory integrations. Setting up monitoring or analysis of the metrics at each Factory level is time-consuming and hard to maintain for businesses that use a significant number of Data Factories. It always needs an expert’s hand to monitor such solutions, and there has always been a lack in relating these solutions with other platforms.
Turbo360 provides an extended set of capabilities that help address some of the challenges of monitoring Data Factory. In the following paragraph, let us discuss how Turbo360 might be helpful in such demanding circumstances.
Azure Data Factory monitoring using Turbo360
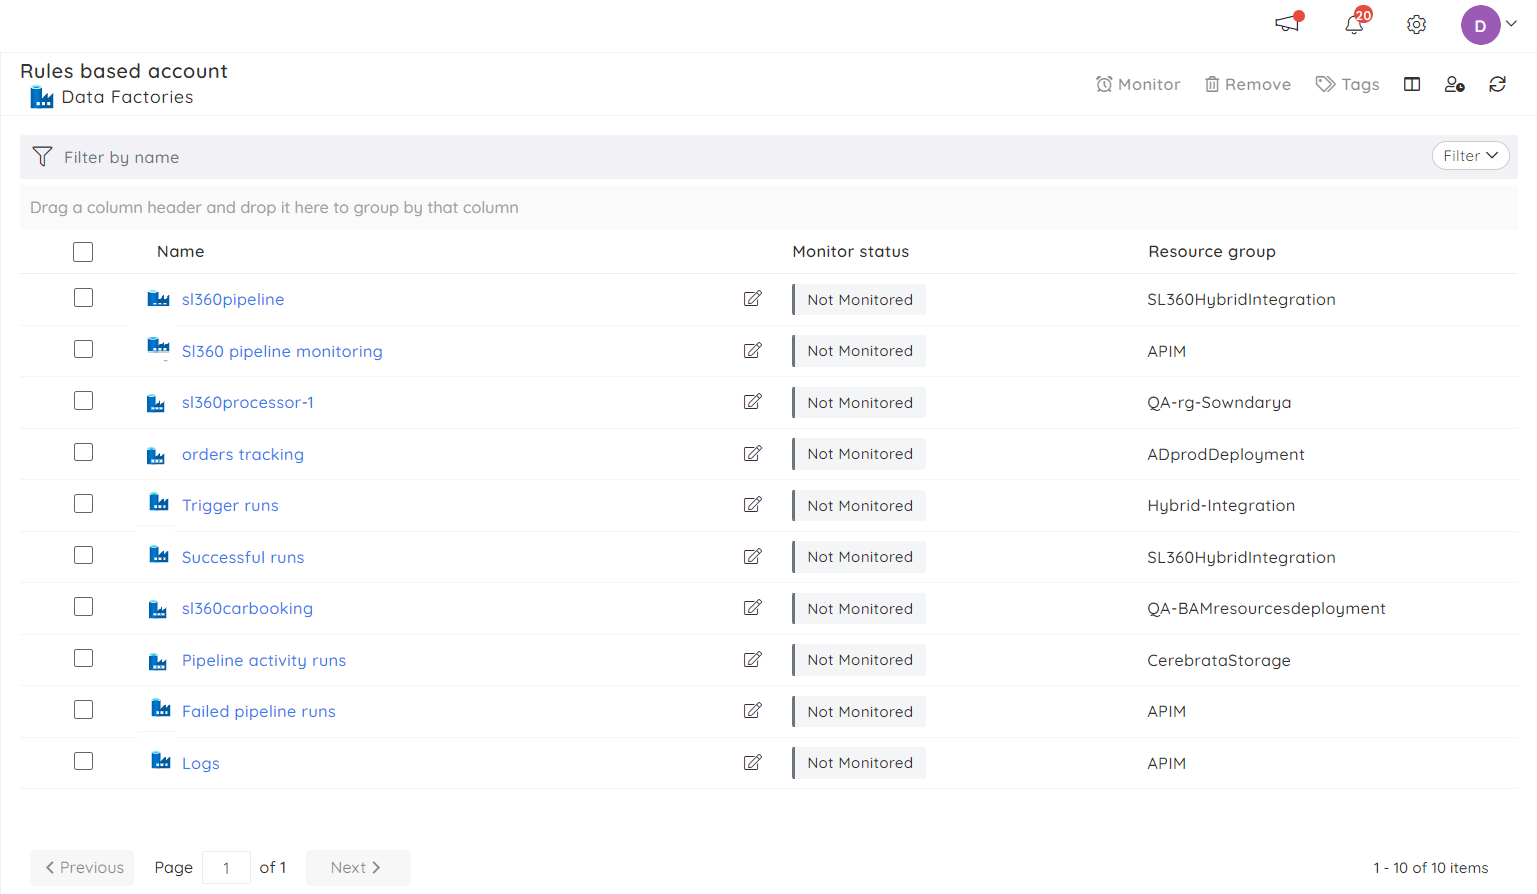
Turbo360 Azure Data Factory monitoring tool provides the best way to manage and monitor multiple Data Factories in a single go via Business Applications. Business Application is a logical container to group Azure Services like Service Bus, Logic Apps, Event Hubs, Event Grid, Data Factory, etc that constitute a Line of Business Solution. Any enterprise can manage and monitor their solution using Business Applications, even if its Azure services are spread across multiple Subscriptions.
When there are too many Data Factories in an extensive application, Turbo360 offers the best monitoring suite, where all these factories can be managed and monitored continuously and simultaneously by grouping them into a Business Application.
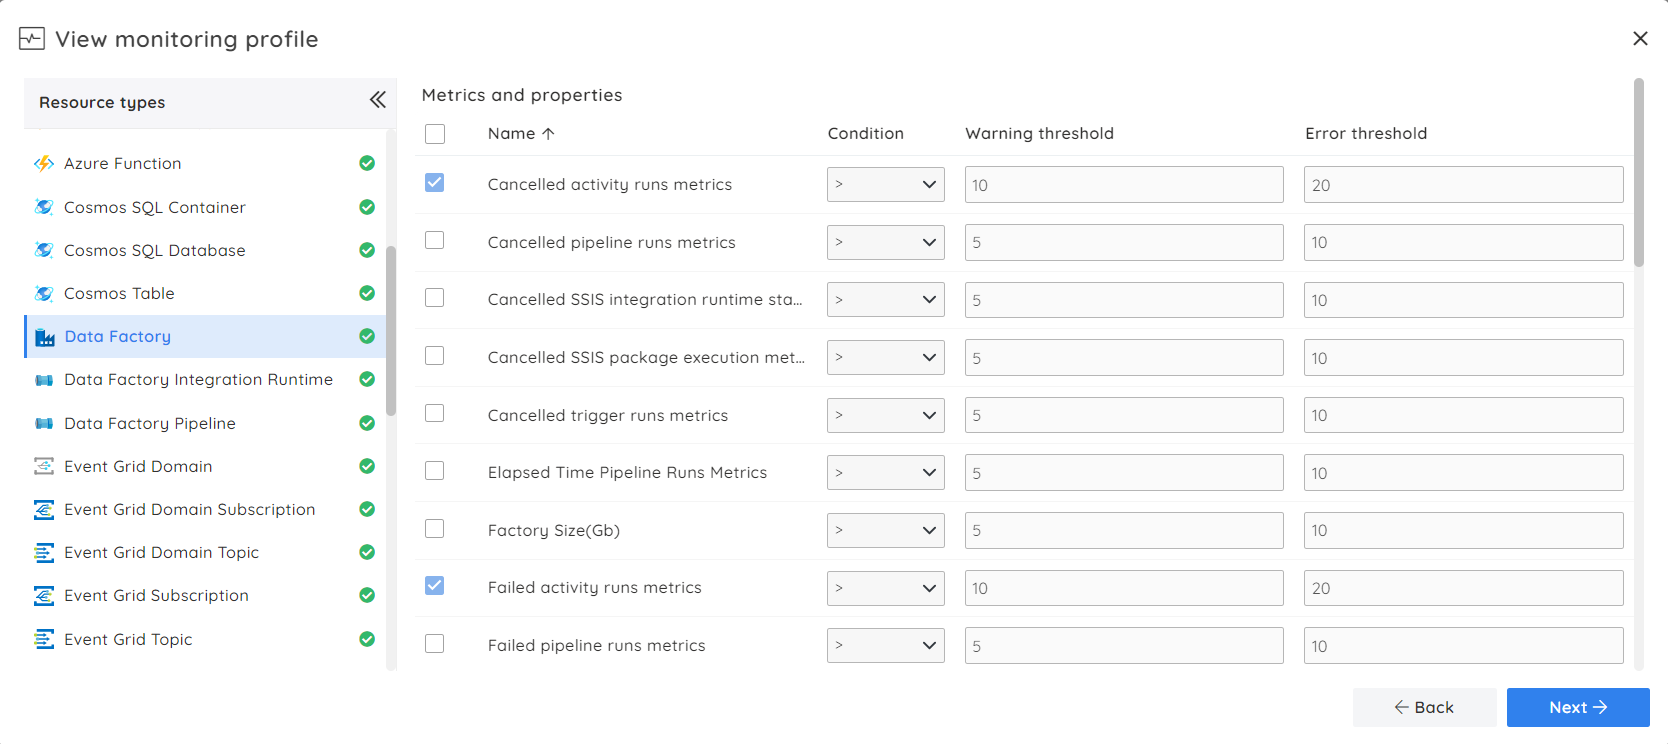
Turbo360 lets you manage and monitor your Data Factory using a range of metrics. When using a data factory in a Business Application, these metrics can be easily configured by selecting the Monitoring Profiles, a set of metrics-based rules. After configuring the required metrics rules, a profile that says the pipeline failure metrics count is more significant than five can immediately be assigned to a business application. This will enable the monitoring of all the Factories in the business application.
Once the business application is configured with a monitoring profile, the Data Factories will get monitored in the background. Data factory monitoring alerts allow users to stay informed on real-time factory issues. The alerts can be triggered to various notification channels like Microsoft Teams, Slack, PagerDuty, OpsGenie, etc.
The customizable dashboards in Turbo360 help understand the performance of the Data Factories. It allows users to build widgets that help analyze failed and successful activity efficiently runs. A widget can be configured with multiple Factories, so tracking the metrics from different factories in a single place is easy.
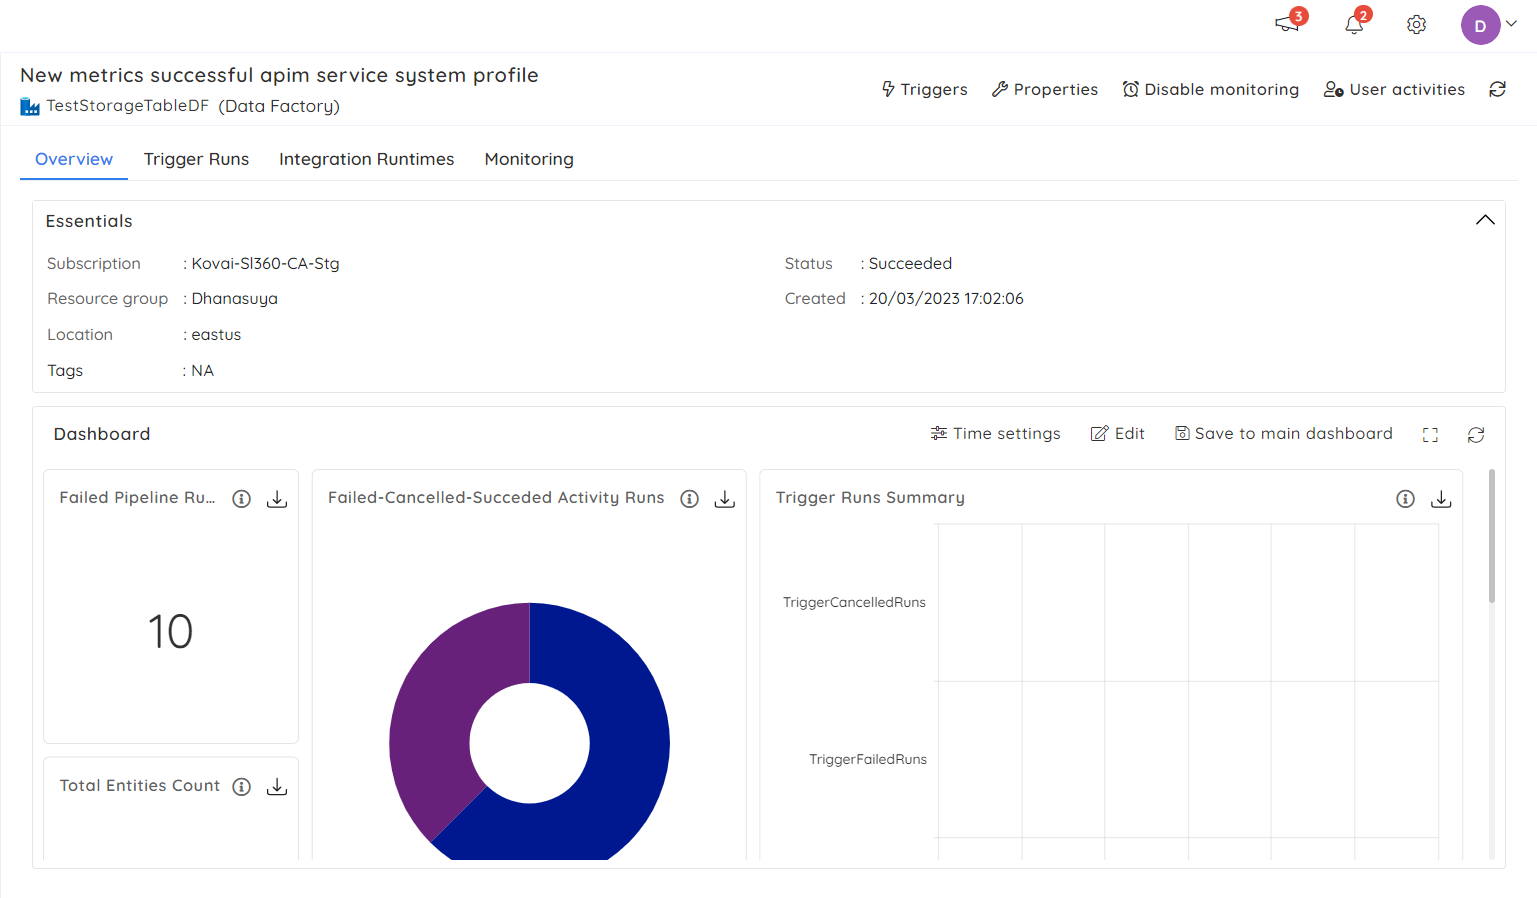
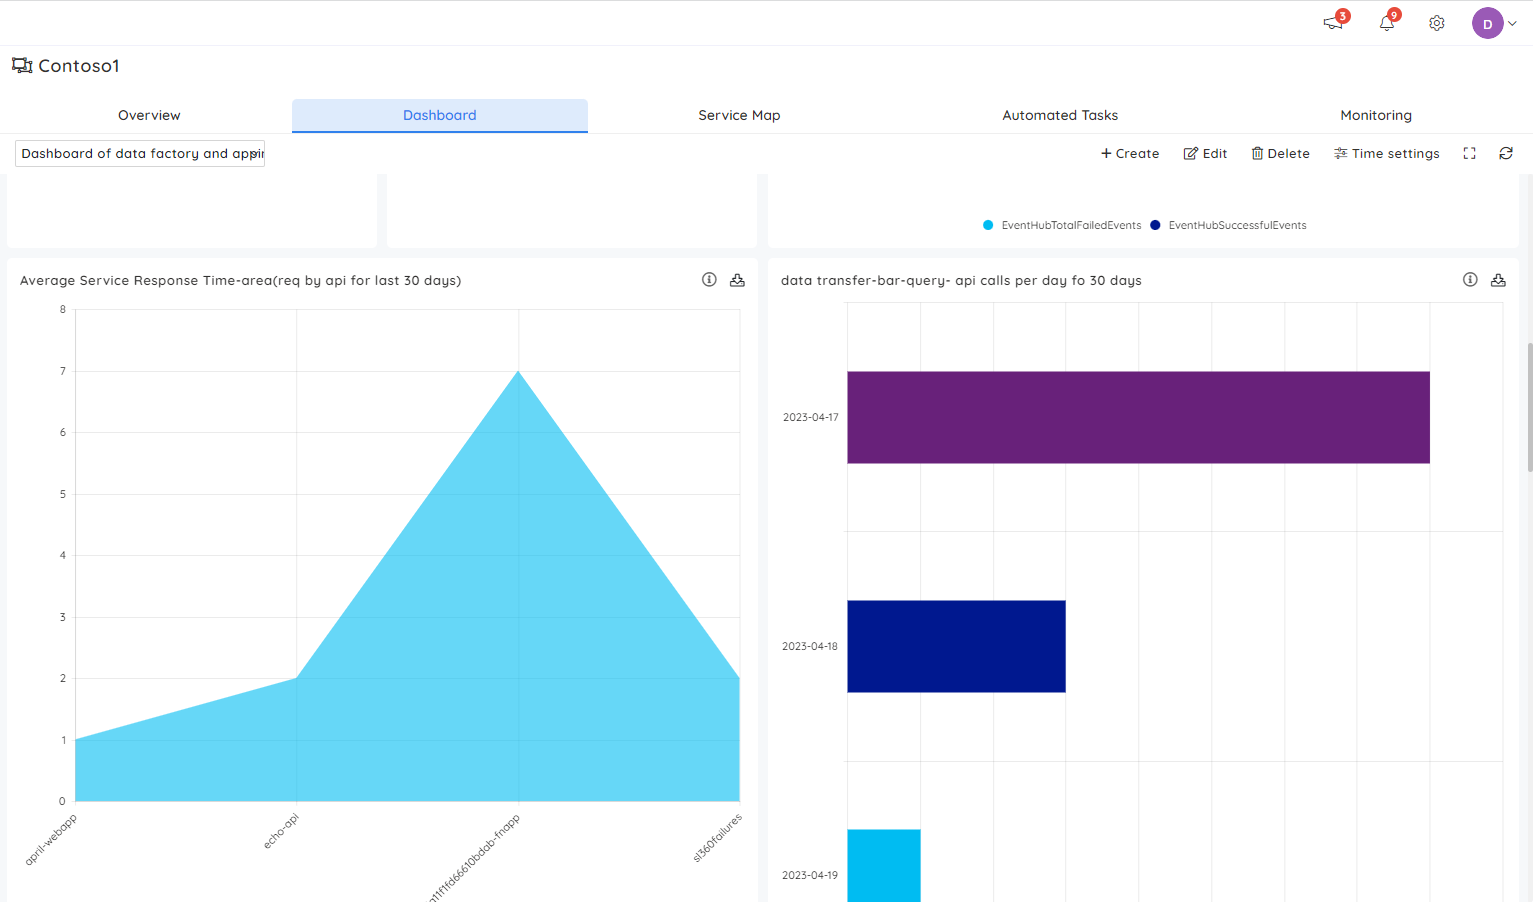
Turbo360’s dashboards can be built at two different levels. At the business application level, the widgets of all the resources from the Business Application can be added, giving a holistic view of how the application is performing. On the other hand, widgets can be configured at the Factory level, which will contain the data specific to that resource.
Data factory pipeline can also be integrated with Business Activity Monitoring(BAM), an Azure end-to-end tracking tool in Turbo360. It allows support teams to get a business view, helping them troubleshoot and fix the identified issues. Here is an article that, explains how Turbo360 BAM can be used to monitor Azure Synapse pipelines.
Similarly, BAM can be instrumented with the Data Factory pipelines, which provide monitoring capabilities over the tracked activity data. Why wait after getting to know about such a fantastic solution for monitoring your Azure Data Factory? Look no further than Business Application in Turbo360. With years of experience and expertise in Azure, Turbo360 is the perfect choice for monitoring your data factory.
It is easy to get started, begin your free trial today and see how Turbo360 can help you get the most out of your Azure data.